

At its next meeting, the Fed could raise interest rates by 25 basis points to a range of 3.75–4.00%. Earlier this year, the Trump administration pressed for lower borrowing costs, but Kevin Warsh’s latest comments have returned inflation to the centre of the policy debate. Economic data remain mixed: the ADP National Employment Report showed that private-sector employment increased by 38,000 in August, below the forecast of 48,000. Meanwhile, real GDP expanded at an annualised rate of 1.5% in the second quarter, matching the previous estimate. July CPI inflation stood at 3.4%, while the Fed’s preferred PCE measure remained at 3.7%, well above its 2.0% target. Renewed pressure on energy prices creates a risk of another acceleration in inflation. The rate-hike outlook has therefore become more hawkish since Warsh’s Jackson Hole speech. CME FedWatch currently puts the probability of a September increase at around 70%, compared with approximately 30% for no change.
The market reaction to renewed geopolitical tensions in early August showed that traders continue to view the dollar as a defensive asset because of its high liquidity, despite the longer-term trend toward de-dollarisation. The currency weakened temporarily during the second-quarter earnings season as some capital moved into equities, but it subsequently recovered.
Higher U.S. Treasury yields also tend to support the dollar, although this relationship is not constant. The 10-year yield traded near 4.80%, its highest level since November 2023, while the 30-year yield briefly approached 5.29%. The latter has risen by approximately 11 basis points from around 5.17% in late August. This move has coincided with a 1.4% increase in USDX, although percentage changes in bond yields and currency indices should not be treated as directly equivalent.
Overall, elevated Treasury yields and growing confidence in a more hawkish Federal Reserve stance support a gradual USDX advance, although periods of sideways consolidation remain possible.
Technical indicators retain a buy signal. On the weekly chart, the index is forming a broadening formation with boundaries at 112.00 and 93.00, within which another upward wave is developing.
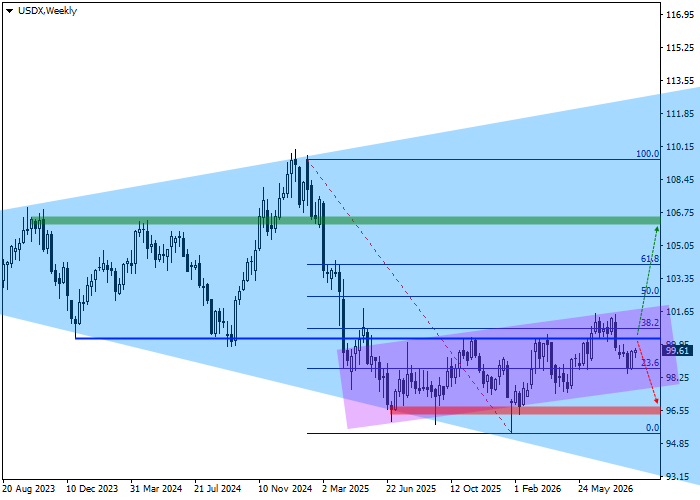
The main factors point to a high probability that the current upward wave will continue toward the pattern’s resistance line at 112.00.
The key levels should be considered on the daily timeframe.
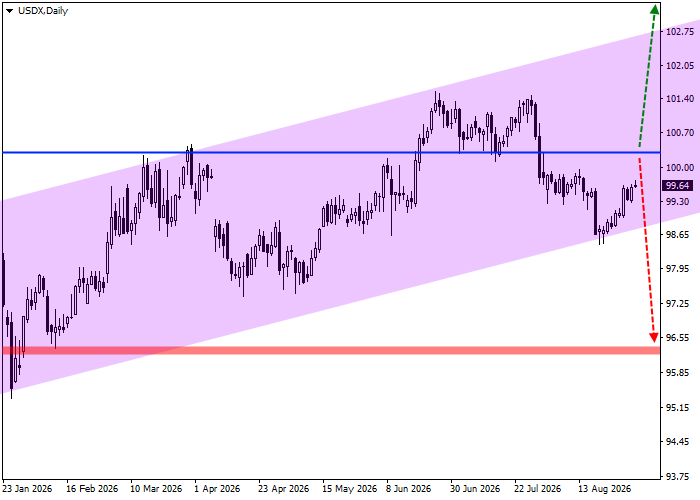
If the price consolidates above the 38.2% Fibonacci retracement, the probability of further growth will increase. As the chart shows, the upward wave generated by the triple-bottom reversal pattern is already well advanced. Its projected target coincides with the midpoint of the broader formation near 106.00, above the 61.8% Fibonacci retracement. This area may be used to take profit on existing long positions. However, a reversal toward the yearly low of 96.50 would either invalidate the bullish scenario or delay it significantly, providing a reason to close open long positions.
More precise entry levels should be assessed on the four-hour timeframe.
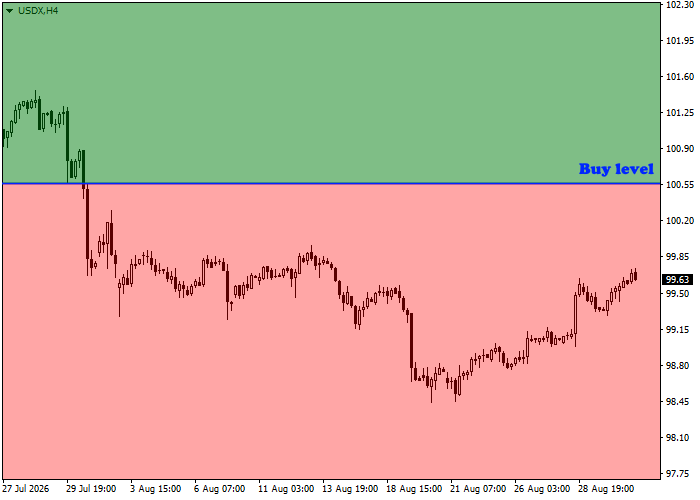
The entry level for long positions is located at 100.50, which coincides with a cluster of highs recorded late last year and early this year. A local signal could appear within the next few days: after a breakout above this level, no major technical barriers would remain before the 106.00 target.
Based on the instrument’s average daily volatility of 29 points over the past month, the distance from 100.50 to 106.00 equals approximately 19 average daily ranges. Since markets rarely move in a straight line, the actual move may take longer.
