
At its September 2 meeting, the Bank of Canada kept its policy rate unchanged at 2.25%. Contrary to earlier expectations of a dovish signal, officials said that upside risks to inflation had increased, while new US tariffs made the outlook for economic growth more uncertain.
Trade tensions remain a risk for the Canadian economy. The United States imposed 50% tariffs on C$27.6 billion of Canadian goods after negotiations collapsed. Ottawa responded with matching duties of 15%, 25% and 50% on selected US products, including steel, dairy goods, appliances, agricultural equipment, pulp and paper, and electronics. The Canadian counter-tariffs will take effect on September 8.
Nevertheless, recent data indicate that the economy remains resilient. Real gross domestic product increased by 0.8% in the second quarter, following a revised gain of 0.1% in the previous period. The S&P Global Canada Manufacturing PMI eased from 53.5 to 53.0 in August but remained above the 50.0 threshold that separates expansion from contraction. FORECK.INFO previously examined the effects of tariffs and Canadian economic data in its earlier USD/CAD outlook.
Meanwhile, markets see a realistic possibility that the Federal Reserve will raise interest rates twice before the end of the year. Fed Chair Kevin Warsh has said that financial conditions are not restrictive and that the labour market remains consistent with full employment, although he has not committed to a specific decision.
The CME FedWatch Tool currently indicates a roughly 70% probability of a 25-basis-point rate increase in September. Futures pricing also implies an approximately 55% chance of an additional increase in December. The effect of geopolitical and inflation risks on monetary expectations was discussed in FORECK.INFO’s recent Fed outlook.
Overall, the fundamental backdrop remains moderately supportive of further USD/CAD gains, although the Bank of Canada’s concern about inflation could limit the pair’s upside.
Support and Resistance Levels
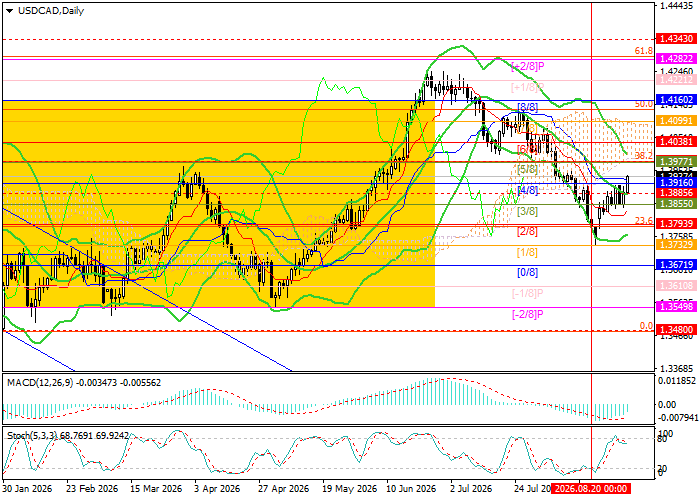
USD/CAD has resumed its advance after reversing from 1.3732, the Murrey [1/8] level, and is approaching the upper Bollinger Band at 1.3977, which also corresponds to Murrey [5/8] and the 38.2% Fibonacci retracement. A breakout above this level could open the way toward 1.4160, the Murrey [8/8] level and upper boundary of the long-term sideways range, followed by 1.4282, the Murrey [+2/8] level and 61.8% Fibonacci retracement.
Conversely, a renewed break below 1.3793, the Murrey [2/8] level and 23.6% Fibonacci retracement, could return the pair to 1.3610, 1.3549 and 1.3480.
Technical indicators provide mixed signals. The Bollinger Bands are pointing lower, the MACD histogram is contracting in negative territory, while the Stochastic oscillator has reached the overbought area and may reverse downward.
Resistance levels: 1.3977, 1.4160, 1.4282.
Support levels: 1.3793, 1.3610, 1.3549, 1.3480.
USD/CAD Trading Scenarios and Price Forecast
Long positions may be considered after the price breaks and consolidates above 1.3977, with targets at 1.4160 and 1.4282 and a stop-loss at 1.3880. Time frame: 5–7 days.
Short positions may be considered after the price breaks and consolidates below 1.3793, with targets at 1.3610, 1.3549 and 1.3480 and a stop-loss at 1.3885.
Scenario
| Timeframe | Weekly |
| Recommendation | BUY STOP |
| Entry Point | 1.3977 |
| Take Profit | 1.4160, 1.4282 |
| Stop Loss | 1.3880 |
| Key Levels | 1.3480, 1.3549, 1.3610, 1.3793, 1.3977, 1.4160, 1.4282 |
Alternative Scenario
| Recommendation | SELL STOP |
| Entry Point | 1.3793 |
| Take Profit | 1.3610, 1.3549, 1.3480 |
| Stop Loss | 1.3885 |
| Key Levels | 1.3480, 1.3549, 1.3610, 1.3793, 1.3977, 1.4160, 1.4282 |
