

In April, the US Consumer Price Index rose from 3.3% to a three-year high of 3.8% year-on-year, exceeding the 3.7% forecast, while the core reading climbed from 2.6% to 2.8% against an expected 2.7%. The Producer Price Index accelerated from 4.3% to 6.0%, with the core measure rising from 4.0% to 5.2%. Inflation has thus intensified significantly, yet the labor market shows no signs of cooling — unemployment held at 4.3% over the same period, and non-farm payrolls added 115,000 jobs. This data increases the probability that the Fed will refrain from adjusting monetary policy through year-end and does not rule out the possibility of tightening in the medium term — a scenario hinted at by several Fed officials, including Boston Fed President Susan Collins and Kansas City Fed President Jeffrey Schmid. Demand for the dollar as a safe-haven asset has also been boosted by President Donald Trump's hawkish rhetoric toward Iran: on Sunday he posted on Truth Social that the Islamic Republic had little time left to meet White House demands, a statement markets interpreted as signaling a possible resumption of military action in the Middle East in the near term.
The euro is under pressure following the release of GDP data: in the first quarter, growth slowed from 0.2% to 0.1% quarter-on-quarter and from 1.2% to 0.8% year-on-year. In addition, March industrial production rose just 0.2% month-on-month against an expected 0.3%, and contracted 2.1% year-on-year. Analysts expect the economic situation across European countries to deteriorate further, as the global energy crisis deepens and high US tariffs continue to erode external demand for EU goods.
Overall, fundamental factors continue to favor further downside in EUR/USD.
Support and Resistance Levels
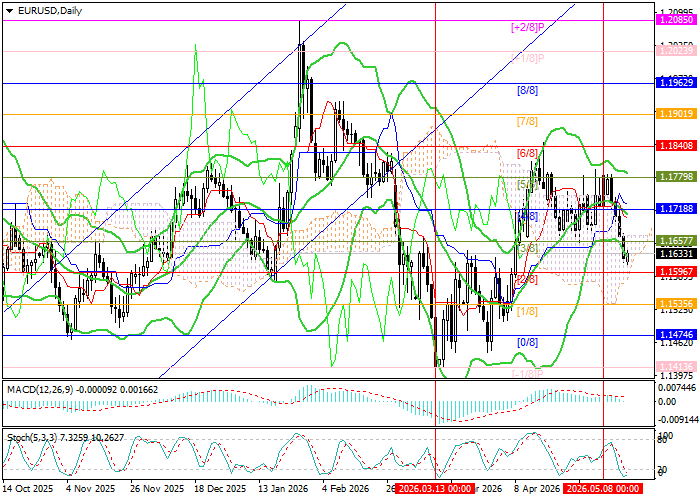
The pair is approaching 1.1596 (Murray level [2/8]): a confirmed close below it would open the way toward 1.1474 (Murray level [0/8]) and 1.1413 (Murray level [–1/8]), while consolidation above the Bollinger Bands middle line at 1.1718 (Murray level [4/8]) would signal a continuation of the uptrend toward 1.1840 (Murray level [6/8]) and 1.1962 (Murray level [8/8]).
Technical indicators are maintaining a sell signal: the Bollinger Bands are turning downward, the MACD histogram is preparing to cross into negative territory and generate a sell signal, though the Stochastic reaching oversold territory leaves room for a limited corrective bounce.
Resistance levels: 1.1718, 1.1840, 1.1962.
Support levels: 1.1596, 1.1474, 1.1413.
EUR/USD Trading Scenarios and Price Forecast
Short positions can be opened below 1.1596, targeting 1.1474 and 1.1413, with a stop-loss at 1.1680. Time horizon: 5–7 days.
Long positions can be opened above 1.1718, targeting 1.1840 and 1.1962, with a stop-loss at 1.1630.
| Scenario | |
|---|---|
| Timeframe | Weekly |
| Recommendation | SELL STOP |
| Entry Point | 1.1595 |
| Take Profit | 1.1474, 1.1413 |
| Stop Loss | 1.1680 |
| Key Levels | 1.1413, 1.1474, 1.1596, 1.1718, 1.1840, 1.1962 |
| Alternative Scenario | |
|---|---|
| Recommendation | BUY STOP |
| Entry Point | 1.1720 |
| Take Profit | 1.1840, 1.1962 |
| Stop Loss | 1.1630 |
| Key Levels | 1.1413, 1.1474, 1.1596, 1.1718, 1.1840, 1.1962 |
