

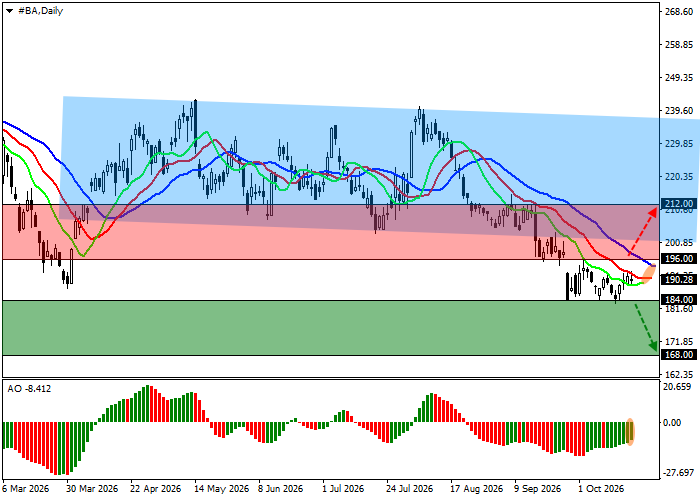
On the daily chart, the price remains below the support line of a descending channel with dynamic boundaries at 238.00–200.00 and continues to move further away from it. The current decline marks a shift from the higher price levels discussed in our previous Boeing stock forecast.
On the four-hour chart, the stock may retest the 184.00 level. A break below this mark could extend the decline toward 168.00, while a recovery toward 195.00 may signal the beginning of positive price momentum.
Technical indicators are strengthening their sell signal: the fast exponential moving averages (EMAs) of the Alligator indicator remain below the slow ones, maintaining a stable spread, while the Awesome Oscillator (AO) histogram is forming declining bars in negative territory.
Boeing Stock Trading Scenarios and Price Forecast
Short positions may be opened after the price declines and consolidates below 184.00, with a target at 168.00. Stop-loss: 190.00. Estimated implementation period: 7 days or more.
Long positions may be opened after the price rises and consolidates above 196.00, with a target at 212.00. Stop-loss: 190.00.
Scenario
| Timeframe | Weekly |
| Recommendation | SELL STOP |
| Entry Point | 184.00 |
| Take Profit | 168.00 |
| Stop Loss | 190.00 |
| Key Levels | 168.00, 184.00, 196.00, 212.00 |
Alternative Scenario
| Recommendation | BUY STOP |
| Entry Point | 196.00 |
| Take Profit | 212.00 |
| Stop Loss | 190.00 |
| Key Levels | 168.00, 184.00, 196.00, 212.00 |
