

The likelihood of a stronger lira remains low: at the start of each trading week, the instrument tends to open with an upward gap and then move gradually higher without fully closing it, as the Central Bank of the Republic of Turkey carries out micro-interventions during the week, while the effect is smoothed by forward contracts that limit sharp spikes in volatility. At the same time, large over-the-counter US dollar transactions over the weekend lead to price jumps when trading resumes on Monday. Additional pressure comes from the relatively high level of the US currency, prompting investors to reduce carry trade operations and shift away from high-risk assets in favour of more stable ones. Under these conditions, Turkish macroeconomic statistics are currently unable to materially affect the pair’s performance, and their impact is therefore limited. Similar dynamics in the pair were discussed in our previous USD/TRY forecast.
Yesterday, the US dollar returned to 101.50 in the USDX amid the latest housing market report: in September, housing starts declined by 5.2% to 1.221 million from 1.288 million a month earlier, while building permits totalled 1.400 million, slightly below the previous 1.403 million. As a result, this sector remains one of the few areas holding back a more stable economic recovery. The probability of an interest rate change this month remains minimal: this morning, according to the CME FedWatch Tool, it stood at 85.1% compared with 81.2% a week earlier.
Overall, the probability of further strengthening in USD/TRY remains high in the long term.
Support and resistance levels
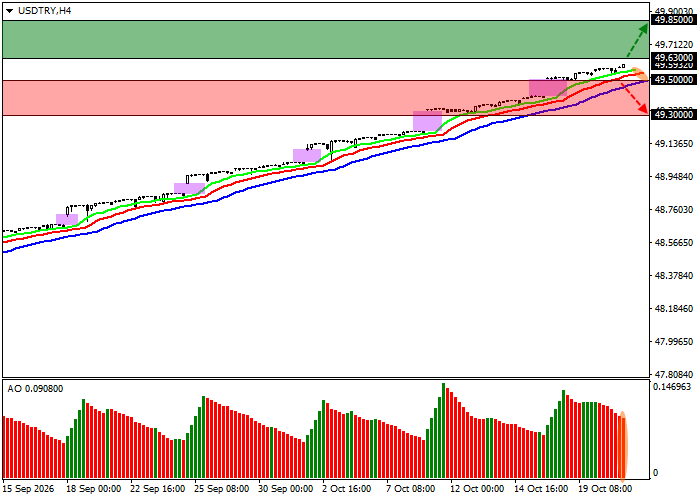
On the four-hour chart, the global upward trend remains in place: the quotes are approaching a key resistance level, a breakout of which could trigger an upward price gap and a resumption of growth.
Technical indicators are strengthening their stable buy signal: the range of fluctuation of the EMA lines of the Alligator indicator is expanding in the direction of growth, while the AO histogram is forming corrective bars in positive territory.
Support levels: 49.5000, 49.3000.
Resistance levels: 49.6300, 49.8500.
Trading Scenarios and USD/TRY Forecast
Long positions may be opened after the price rises and consolidates above 49.6300, with a target at 49.8500. Stop-loss: 49.5500. Estimated implementation period: 7 days or more.
Short positions may be opened after the price declines and consolidates below 49.5000, with a target at 49.3000. Stop-loss: 49.6000.
Scenario
| Timeframe | Weekly |
| Recommendation | BUY STOP |
| Entry Point | 49.6300 |
| Take Profit | 49.8500 |
| Stop Loss | 49.5500 |
| Key Levels | 49.3000, 49.5000, 49.6300, 49.8500 |
Alternative Scenario
| Recommendation | SELL STOP |
| Entry Point | 49.5000 |
| Take Profit | 49.3000 |
| Stop Loss | 49.6000 |
| Key Levels | 49.3000, 49.5000, 49.6300, 49.8500 |
