

The euro's weakness is largely associated with structural problems in the European Union, aggravated by rising oil prices amid escalating geopolitical tensions in the Persian Gulf region. Additional pressure on the single currency comes from the deepening fiscal and political crisis in France, which is increasing uncertainty about the European Central Bank's (ECB) monetary policy outlook. This week, investors will receive September inflation data from the bloc's largest economies, while Germany's final Consumer Price Index was released earlier today. The indicator increased from 0.2% to 0.6% month-on-month and from 2.9% to 3.3% year-on-year, in line with analysts' expectations. The EU-harmonised annual inflation rate also rose from 2.9% to 3.3%, matching forecasts and increasing pressure on the regulator. ECB officials now face the challenge of containing persistent inflation while taking into account weaker economic conditions and growing financial risks associated with France's debt situation.
The US dollar, which remains a key driver of the pair, is trading near 102.20 on the USDX, supported by elevated energy prices and expectations surrounding Federal Reserve monetary policy. Tomorrow, October 14, at 14:30 (GMT+2), investors will focus on the September US Consumer Price Index. Headline inflation is expected to accelerate from 0.4% to 0.6% month-on-month and from 3.4% to approximately 3.6–3.7% year-on-year, while the annual core indicator may increase from 2.4% to 2.5%. Against this background, the probability of the Federal Reserve keeping interest rates unchanged at its October meeting has declined slightly from 82.3% at the end of last week to around 80.6%, according to the CME FedWatch Tool, although a pause remains the most likely outcome.
As discussed in our previous EUR/USD forecast, the euro remains under pressure from the stronger US dollar and European economic uncertainty, while the market continues to assess the possibility of further downside movement.
Support and resistance levels
On the daily chart, the trading instrument remains below the resistance line of the global descending channel with dynamic boundaries of 1.1640–1.1170.
Technical indicators are strengthening the sell signal: the fast EMAs of the Alligator indicator remain below the slow ones, maintaining a stable fluctuation range, while the AO histogram is forming corrective bars in negative territory.
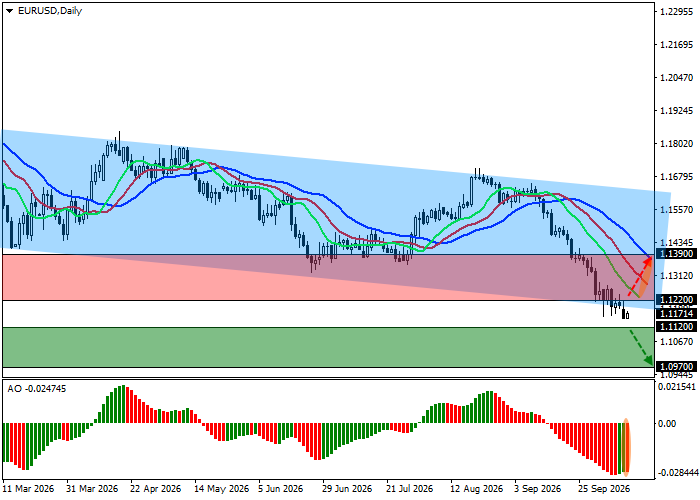
Support levels: 1.1120, 1.0970.
Resistance levels: 1.1220, 1.1390.
EUR/USD trading scenarios and exchange rate forecast
Short positions may be opened after the price declines and consolidates below 1.1120, with a target at 1.0970. Stop-loss — 1.1210. Estimated implementation period: 7 days or more.
Long positions may be opened after the price rises and consolidates above 1.1220, with a target at 1.1390. Stop-loss — 1.1140.
Scenario
| Timeframe | Weekly |
| Recommendation | SELL STOP |
| Entry point | 1.1120 |
| Take Profit | 1.0970 |
| Stop Loss | 1.1210 |
| Key levels | 1.0970, 1.1120, 1.1220, 1.1390 |
Alternative scenario
| Recommendation | BUY STOP |
| Entry point | 1.1220 |
| Take Profit | 1.1390 |
| Stop Loss | 1.1140 |
| Key levels | 1.0970, 1.1120, 1.1220, 1.1390 |
