

The British stock market remains relatively stable amid the Bank of England's monetary policy outlook, while the latest retail sales report from the British Retail Consortium (BRC) points to continued, albeit modest, consumer spending growth. During the five weeks ending October 3, total retail sales increased by 1.3% year-on-year, slightly below the 12-month average of 1.5%. Food sales rose by 2.5%, compared with an average of 3.1%, while non-food sales increased by 0.3%, including a 0.1% rise in in-store sales. Online non-food sales advanced by 0.7%, below the average growth of 1.3%, while the online penetration rate increased from 37.9% in September 2025 to 38.3% in September 2026, exceeding the previous year's level and reflecting the continued development of digital retail.
Meanwhile, the UK government bond market is showing signs of stabilisation following the recent surge in yields caused by inflation concerns and elevated energy prices. The yield on short-term one-year securities has eased slightly from around 4.596% last week to approximately 4.591%, while benchmark 10-year gilt yields have been trading near 5.44%, compared with approximately 5.423% on Friday. The yield on longer-term 20-year bonds has declined from around 5.956% to 5.893%, while 30-year gilt yields have retreated from approximately 5.981% to 5.932%. On Tuesday, the benchmark 10-year yield eased further toward 5.40% as oil prices moderated and global government bond markets recovered. Nevertheless, borrowing costs remain elevated, limiting the potential for sustained gains in UK equities.
Among the leading FTSE 100 gainers in the previous trading session were ConvaTec Group Plc. (+4.82%), Lion Finance Group Plc. (+2.75%), Lloyds Banking Group Plc. (+2.36%), HSBC Holdings Plc. (+2.34%) and Diageo Plc. (+2.14%).
Meanwhile, declining shares included Informa Plc. (–2.41%), IG Group Holdings Plc. (–1.86%), Vodafone Group Plc. (–1.39%), Polar Capital Technology Trust Plc. (–1.28%) and ICG Plc. (–0.50%).
As discussed in our previous FTSE 100 forecast, movements in UK government bond yields and geopolitical developments remain important factors influencing the index's short-term direction.
Support and resistance levels
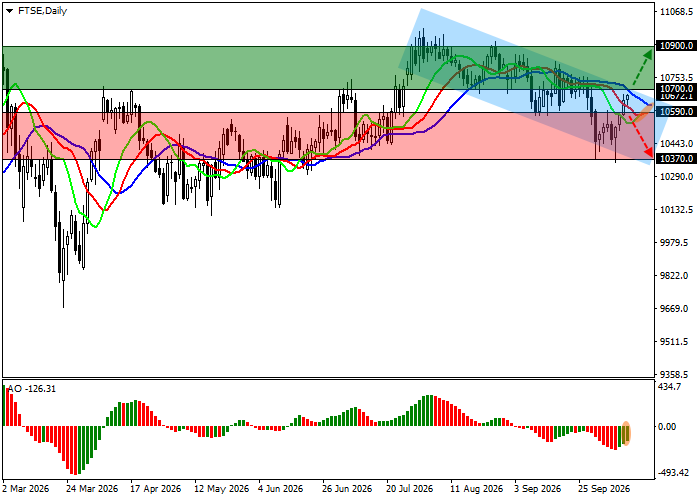
On the daily chart, the trading instrument is testing the resistance line of the local descending channel with dynamic boundaries of 10650.0–10300.0.
Technical indicators are weakening an unstable sell signal: the fluctuation range of the Alligator indicator's EMAs is gradually narrowing, while the AO histogram is forming corrective bars in negative territory.
Support levels: 10590.0, 10370.0.
Resistance levels: 10700.0, 10900.0.
FTSE 100 trading scenarios and price forecast
Long positions may be opened after the price rises and consolidates above 10700.0, with a target at 10900.0 and a stop-loss at 10600.0. The trading scenario specifies an entry point at 10732.0 after the breakout is confirmed. Estimated implementation period: 7 days or more.
Short positions may be opened after the price declines and consolidates below 10590.0, with a target at 10370.0. Stop-loss — 10700.0.
Scenario
| Timeframe | Weekly |
| Recommendation | BUY |
| Entry point | 10732.0 |
| Take Profit | 10900.0 |
| Stop Loss | 10600.0 |
| Key levels | 10370.0, 10590.0, 10700.0, 10900.0 |
Alternative scenario
| Recommendation | SELL STOP |
| Entry point | 10590.0 |
| Take Profit | 10370.0 |
| Stop Loss | 10700.0 |
| Key levels | 10370.0, 10590.0, 10700.0, 10900.0 |
