
Trading activity in the oil market remains elevated, while prices have been holding above the 100.00 mark for an extended period amid escalating geopolitical tensions in the Persian Gulf. Moreover, recent reports of disruptions to international airline operations in Saudi Arabia due to the intensifying conflict with Yemen's Houthi forces have raised further concerns about regional security and accessibility. UAE-based Etihad Airways has cancelled all flights between Abu Dhabi and Riyadh until October 19, along with several services to Jeddah and Dammam. Qatar Airways has also temporarily suspended flights to Riyadh and Dammam. In addition, transportation companies continue to increase risk premiums. During yesterday's meeting of OPEC and non-OPEC oil ministers in Riyadh, participants noted that disruptions to energy supplies had significantly increased shipping and insurance costs, which now exceed one-third of the value of the transported commodities. These additional expenses are contributing to persistent inflationary pressure and complicating the movement of crude oil and petroleum products.
Meanwhile, investors are awaiting the latest US crude oil inventory reports. The American Petroleum Institute (API) is scheduled to publish its weekly data on October 14, following the previous decline of 2.090 million barrels. On Thursday, October 15, at 18:00 (GMT+2), the US Energy Information Administration (EIA) will release its Weekly Petroleum Status Report, after recording a decrease of 3.186 million barrels in the previous reporting period. Further inventory drawdowns could provide additional support for oil prices, although the market remains sensitive to geopolitical developments and changes in global energy supply conditions. Trading activity remains relatively high as investors assess developments in the Persian Gulf and the risks associated with international oil transportation.
As discussed in our previous Brent Crude Oil forecast, elevated shipping costs and continued uncertainty surrounding the Strait of Hormuz remain important factors supporting oil prices despite periodic downward corrections.
Support and resistance levels
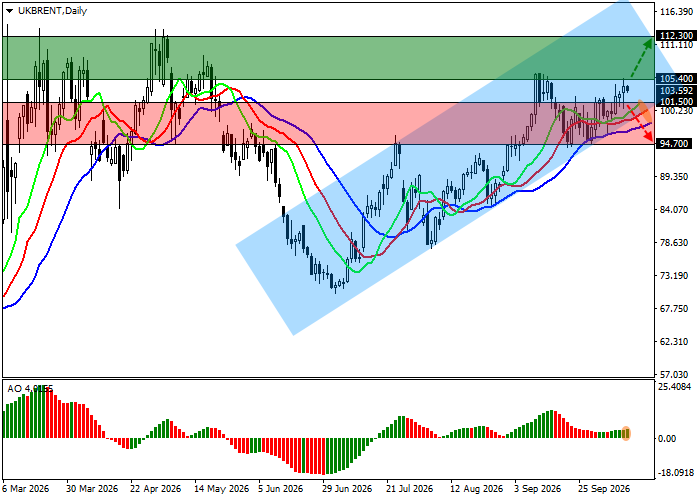
On the daily chart, the trading instrument is moving higher, remaining slightly above the support line of the global ascending channel with dynamic boundaries of 118.00–100.00.
Technical indicators are strengthening the buy signal: the fast EMAs of the Alligator indicator remain above the slow ones and continue moving further away from them, while the AO histogram is forming corrective bars in positive territory.
Support levels: 101.50, 94.70.
Resistance levels: 105.40, 112.30.
Brent Crude Oil trading scenarios and price forecast
Long positions may be opened after the price rises and consolidates above 105.40, with a target at 112.30. Stop-loss — 102.00. Estimated implementation period: 7 days or more.
Short positions may be opened after the price declines and consolidates below 101.50, with a target at 94.70. Stop-loss — 104.00.
Scenario
| Timeframe | Weekly |
| Recommendation | BUY STOP |
| Entry point | 105.40 |
| Take Profit | 112.30 |
| Stop Loss | 102.00 |
| Key levels | 94.70, 101.50, 105.40, 112.30 |
Alternative scenario
| Recommendation | SELL STOP |
| Entry point | 101.50 |
| Take Profit | 94.70 |
| Stop Loss | 104.00 |
| Key levels | 94.70, 101.50, 105.40, 112.30 |
