

Experts continue to discuss the need for further monetary tightening by the Bank of England, although the latest macroeconomic statistics came in better than expected. In August, gross domestic product (GDP) growth slowed from 0.4% to 0.1% month-on-month, while analysts had expected a decline to –0.1%. As a result, the annual reading rose from 1.8% to 2.1%, compared to preliminary estimates of 1.7%.
The next meeting of the regulator will take place at the end of November, and the probability of an interest rate adjustment to 4.00% currently exceeds 80.0%. At the same time, specialists assume at least one more rate increase this year and another one in early 2027, which could eventually bring the benchmark rate to 4.25%.
The US dollar is edging lower despite the absence of new drivers and is currently trading at 101.80 in the USDX. Investors are assessing yesterday’s inflation report, which showed faster growth than expected: in September, the consumer price index reached 0.6% month-on-month and accelerated from 3.4% to 3.7% year-on-year, while the core reading, excluding food and energy, came in at 2.6% versus forecasts of 2.5%.
Against this backdrop, the probability of a Federal Reserve rate hike in October briefly approached 50.0% yesterday. However, subsequent comments from Federal Open Market Committee (FOMC) members Michelle Bowman and Mary Daly, who stated that policymakers need to wait for updated data closer to the meeting date, softened traders’ hawkish sentiment. At the moment, according to the CME FedWatch Tool, the probability of monetary tightening at the upcoming meeting stands at 28.2%.
Support and resistance levels
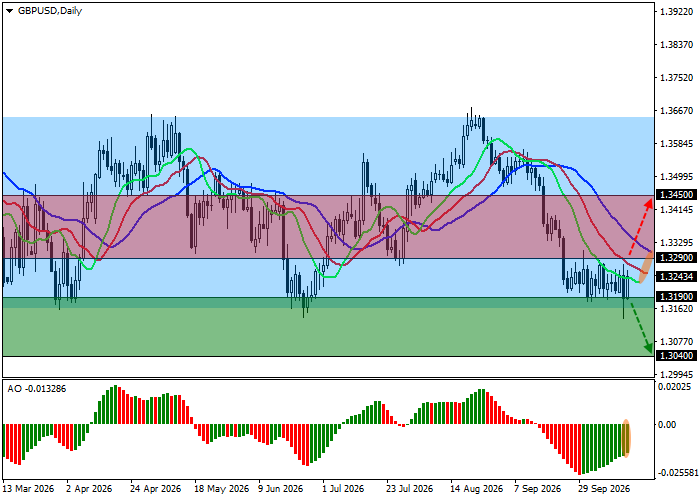
On the daily chart, the trading instrument remains above the support line of the global sideways channel with fixed boundaries at 1.3660–1.3160.
Technical indicators continue to maintain a sell signal: the fast EMAs of the Alligator indicator are significantly below the slow ones, while the AO histogram is forming corrective bars in the negative zone.
Support levels: 1.3190, 1.3040.
Resistance levels: 1.3290, 1.3450.
Trading scenarios and GBP/USD forecast
Short positions may be opened after the price declines and consolidates below 1.3190, with a target at 1.3040. Stop-loss — 1.3280. Implementation period: 7 days or more.
Long positions may be opened after the price rises and consolidates above 1.3290, with a target at 1.3450. Stop-loss — 1.3200.
Scenario
| Timeframe | Weekly |
| Recommendation | SELL STOP |
| Entry point | 1.3190 |
| Take Profit | 1.3040 |
| Stop Loss | 1.3280 |
| Key levels | 1.3040, 1.3190, 1.3290, 1.3450 |
Alternative scenario
| Recommendation | BUY STOP |
| Entry point | 1.3290 |
| Take Profit | 1.3450 |
| Stop Loss | 1.3200 |
| Key levels | 1.3040, 1.3190, 1.3290, 1.3450 |
