

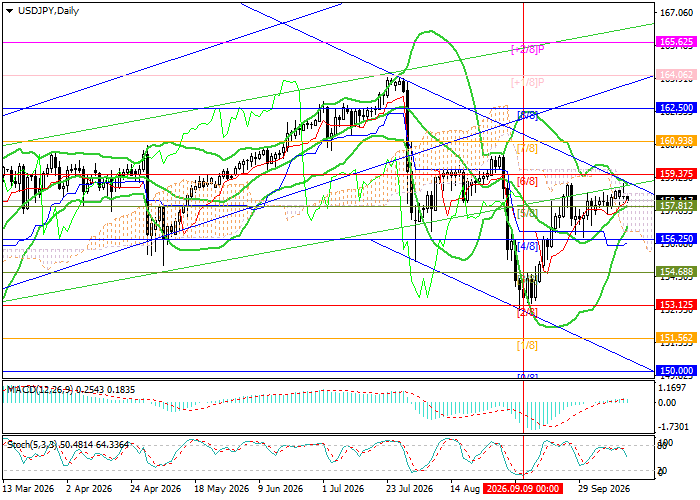
Technical indicators provide mixed signals: the Bollinger Bands are pointing upward, the MACD histogram remains stable in positive territory, while the Stochastic oscillator has turned downward from the overbought zone. On the weekly chart, the price is approaching the middle Bollinger Band at 159.37, and a sustained move above this level could support the formation of a new upward trend.
Support and resistance levels
Resistance levels: 159.37, 162.50, 164.06, 165.62.
Support levels: 156.25, 153.12, 151.56.
USD/JPY Trading Scenarios and Exchange Rate Forecast
Long positions may be opened above 159.37 with targets at 162.50, 164.06 and 165.62 and a stop-loss at 157.20. Estimated implementation period: 5–7 days.
Short positions may be opened below 156.25 with targets at 153.12 and 151.56 and a stop-loss at 158.30.
Scenario
| Timeframe | Weekly |
| Recommendation | BUY STOP |
| Entry Point | 159.37 |
| Take Profit | 162.50, 164.06, 165.62 |
| Stop Loss | 157.20 |
| Key Levels | 151.56, 153.12, 156.25, 159.37, 162.50, 164.06, 165.62 |
Alternative Scenario
| Recommendation | SELL STOP |
| Entry Point | 156.25 |
| Take Profit | 153.12, 151.56 |
| Stop Loss | 158.30 |
| Key Levels | 151.56, 153.12, 156.25, 159.37, 162.50, 164.06, 165.62 |
