

This week marked the start of the key third-quarter corporate earnings season, and investors are beginning to assess results from major financial institutions and banks. JPMorgan Chase & Co. reported managed revenue of 50.9 billion dollars, while diluted earnings per share (EPS) stood at 5.57 dollars, or 5.75 dollars excluding a significant item. Similar figures for The Goldman Sachs Group Inc. reached 18.68 billion dollars in net revenues and 17.01 dollars in EPS, while Wells Fargo & Co. posted 21.87 billion dollars in revenue and EPS of 1.87 dollars.
Lower expectations of further monetary tightening by the Federal Reserve at its 28 October meeting are putting pressure on yields in the debt market. Although the yield on widely followed 12-month securities rose slightly from 4.47% on Friday to 4.48%, the benchmark 10-year Treasury yield declined from 5.24% to 5.21%, the more conservative 20-year yield fell from 5.65% to 5.60%, and the 30-year yield eased from 5.60% at the end of last week to 5.56%.
Among the leaders of growth are CDW Corp. (+5.71%), Valero Energy Corp. (+4.69%), Charter Communications Inc. (+4.36%), Oracle Corp. (+4.23%) and Phillips 66 (+4.00%).
The biggest declines were recorded by Applied Materials Inc. (–6.69%), Johnson & Johnson (–5.73%), Citigroup Inc. (–5.60%), Domino’s Pizza Inc. (–4.76%) and KKR & Co Inc. (–4.75%).
As noted in our previous S&P 500 forecast, the index remains sensitive to movements in Treasury yields, energy prices and geopolitical risks, while the ongoing earnings season may now provide the next major catalyst for direction.
Support and resistance levels
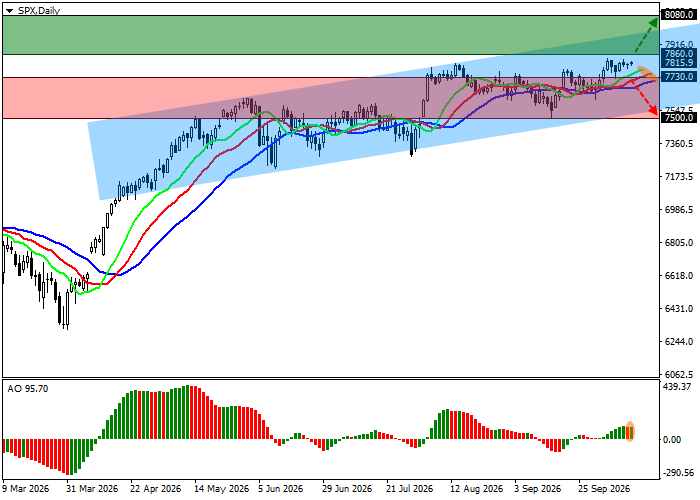
On the daily chart, the trading instrument is moving in a corrective trend, approaching the upper boundary of a local ascending channel with borders at 8000.0–7500.0.
Technical indicators maintain an unstable buy signal: the fast EMAs of the Alligator indicator are positioned above the slow ones, while the AO histogram is forming corrective bars in the positive zone.
Support levels: 7730.0, 7500.0.
Resistance levels: 7860.0, 8080.0.
Trading scenarios and forecast for the S&P 500
Long positions may be opened after the price rises and consolidates above 7860.0, with the target at 8080.0. Stop-loss — 7750.0. Timeframe: 7 days or more.
Short positions may be opened after the price falls and consolidates below 7730.0, with the target at 7500.0. Stop-loss — 7840.0.
Scenario
| Timeframe | Weekly |
| Recommendation | BUY STOP |
| Entry point | 7860.0 |
| Take Profit | 8080.0 |
| Stop Loss | 7750.0 |
| Key levels | 7500.0, 7730.0, 7860.0, 8080.0 |
Alternative scenario
| Recommendation | SELL STOP |
| Entry point | 7730.0 |
| Take Profit | 7500.0 |
| Stop Loss | 7840.0 |
| Key levels | 7500.0, 7730.0, 7860.0, 8080.0 |
