

In September, Australian employment declined by 39.3K after a revised increase of 29.3K in the previous month, while analysts had expected a rise of 19.6K. The unemployment rate remained at 4.7%, above forecasts of 4.6%, while the labour force participation rate decreased from a revised 67.0% to 66.8%, against expectations of 67.0%. The main reason for the negative dynamics was a decline of 73.7K in part-time employment, which was only partially offset by an increase of 34.4K in full-time positions. Overall, labour market data over the past six months suggest that employment conditions are gradually cooling, potentially affecting the Reserve Bank of Australia's (RBA) monetary policy stance. It should be recalled that in September, the regulator raised its benchmark interest rate to 4.60%. However, the latest weak employment report may reduce the likelihood of further tightening in the near future.
The US dollar has retreated from yesterday's highs, with the US Dollar Index (USDX) moving toward 102.00. Meanwhile, inflation data indicate that escalating geopolitical tensions in the Persian Gulf region have put more pressure on the US economy than previously expected. In September, the Consumer Price Index increased by 0.6% month-on-month, while annual inflation accelerated from 3.4% to 3.7%. Core inflation, which excludes food and energy prices, rose from 2.4% to 2.6%. Following the release, market expectations of further Federal Reserve monetary tightening increased, although the probability of an interest rate hike at the October meeting remains volatile. According to the CME FedWatch Tool, investors continue to reassess the likelihood of changes in borrowing costs as new economic data and comments from Federal Reserve officials become available.
Under these conditions, a continuation of the local downward movement in AUD/USD appears to be the most likely scenario. As discussed in our previous AUD/USD forecast, the Australian dollar remains sensitive to diverging monetary policy expectations between the RBA and the Federal Reserve, while weak domestic economic indicators could increase selling pressure.
Support and resistance levels
On the daily chart, the trading instrument is moving within a global range defined by first-order (I) levels, trading near the first-order (I) left support level at 0.6950. The most likely scenario is a decline toward the global intersection of first-order (I) left and right support levels at 0.6905, followed by the intersection of third-order (III) left and right support levels at 0.6805. However, in the event of a reversal, further price movement could develop within a weak upward trend toward the intersection of third-order (III) right and left resistance levels at 0.6999, followed by the intersection of second-order (II) right and left resistance levels at 0.7105.
Support levels: 0.6905, 0.6805.
Resistance levels: 0.6999, 0.7105.
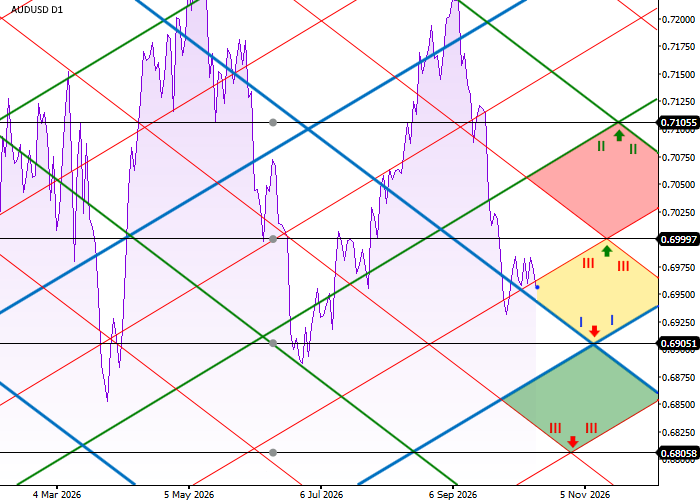
AUD/USD trading scenarios and exchange rate forecast
Short positions may be opened after the price consolidates below 0.6905, with a target at 0.6805. Stop-loss — 0.6980. Estimated implementation period: 7 days or more.
Long positions may be opened after the price consolidates above 0.6999, with a target at 0.7105. Stop-loss — 0.6910.
Scenario
| Timeframe | Weekly |
| Recommendation | SELL STOP |
| Entry point | 0.6905 |
| Take Profit | 0.6805 |
| Stop Loss | 0.6980 |
| Key levels | 0.6805, 0.6905, 0.6999, 0.7105 |
Alternative scenario
| Recommendation | BUY STOP |
| Entry point | 0.6999 |
| Take Profit | 0.7105 |
| Stop Loss | 0.6910 |
| Key levels | 0.6805, 0.6905, 0.6999, 0.7105 |
