

Against this background, eurozone inflation accelerated from 3.2% to 3.8% in September, according to Eurostat's preliminary estimate, while the ECB's main refinancing rate currently stands at 2.65%, with the deposit facility rate at 2.50%. These monetary conditions may prove insufficient to contain persistent price pressures without further policy tightening. In the United Kingdom, meanwhile, the latest available official data showed annual consumer price inflation rising from 2.9% to 3.1% in August, while the Bank of England has maintained its benchmark interest rate at 3.75%. Thus, ECB officials may need to continue their hawkish monetary policy stance at the next meeting and potentially beyond. The Bank of England, on the other hand, has some room to pause before taking further action, as six of the nine Monetary Policy Committee members voted to leave borrowing costs unchanged at their latest meeting. More stable inflation dynamics in the United Kingdom could eventually provide the British pound with a longer-term advantage over the euro, although both currencies remain exposed to energy-related risks.
Our earlier EUR/GBP analysis examined a period when stronger European economic data supported the single currency. The subsequent energy shock and divergence in inflationary pressures have since changed the fundamental outlook, leaving the medium-term bearish scenario in focus.
Technical indicators maintain a sell signal: on the weekly chart, EUR/GBP continues to move within a correction to the previous upward trend, which ended after the pair reached a high near 0.8850.
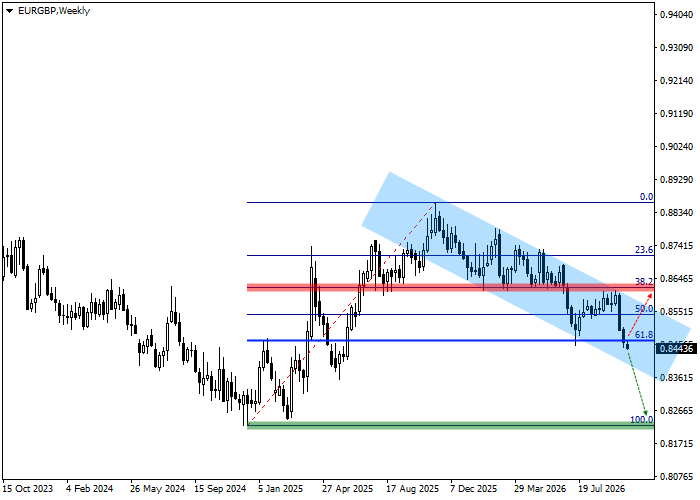
After breaking below the support line of the previous trading range late last year, the pair entered a downward corrective phase and has already passed the levels of 0.8700 (23.6% Fibonacci retracement), 0.8620 (38.2% Fibonacci retracement) and 0.8540 (50.0% Fibonacci retracement).
The key levels are best assessed on the daily timeframe.
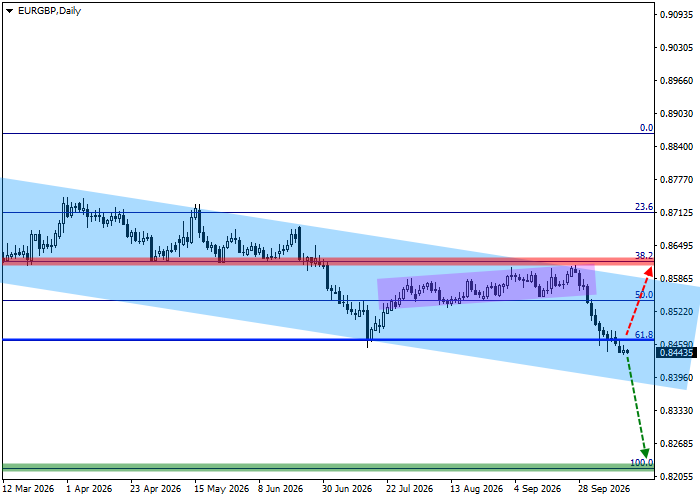
As shown on the chart, the price continues to decline within a local descending channel with boundaries at 0.8600–0.8400. This week, the pair is attempting to consolidate below the final key Fibonacci support level at 0.8470 (61.8% Fibonacci retracement), potentially extending the decline toward the December 2024 low at 0.8220. This area is considered the main target for taking profit on existing short positions. The 0.8620 level (38.2% Fibonacci retracement) represents the invalidation zone for the bearish scenario. If the price returns to this level and consolidates above it, the downward trend may either be cancelled or significantly delayed, in which case short positions should be closed.
More precise entry levels can be assessed on the four-hour timeframe.
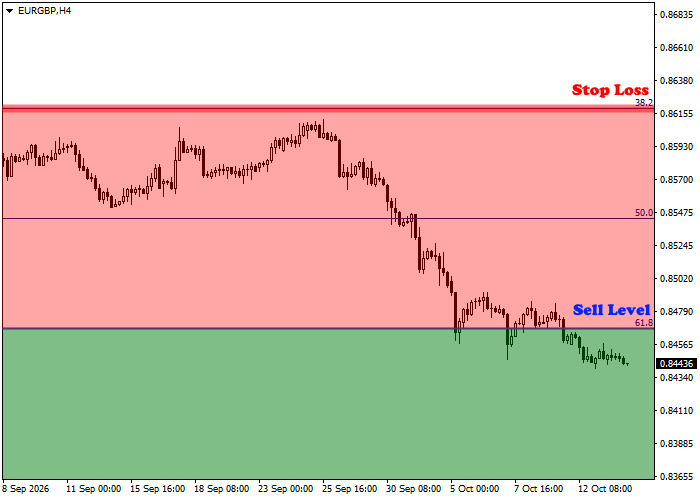
The key entry level for short positions was located near 0.8470 (61.8% Fibonacci retracement). The pair has already moved below its autumn low, providing additional technical confirmation of the broader bearish setup.
Taking into account the average daily volatility of approximately 20.0 pips over the past month, the decline toward the target area at 0.8220 may develop over an estimated 56 trading sessions. If volatility increases and downward momentum strengthens, this period could shorten to approximately 45 trading sessions. These estimates are indicative and depend on the pace of the trend, possible corrective rebounds and changing market conditions.
EUR/GBP trading outlook
The main scenario assumes a continuation of the downward movement toward 0.8220 following a confirmed consolidation below 0.8470. The bearish outlook would be invalidated if the pair recovers and consolidates above 0.8620.
Main scenario
| Timeframe | Quarterly outlook |
| Recommendation | SELL |
| Entry zone | Below 0.8470 |
| Take Profit | 0.8220 |
| Scenario invalidation | 0.8620 |
| Key levels | 0.8220, 0.8470, 0.8540, 0.8620, 0.8700 |
Market outlook
| Trend | Bearish |
| Fundamental outlook | Potentially supportive of GBP |
| Technical signal | SELL |
| Average daily volatility | 20 pips |
| Estimated horizon | 45–56 trading sessions |
| Key risk | Breakout above 0.8620 |
