

Investors remain focused on the conflict in the Middle East, where the open confrontation between Yemen’s Houthi forces and Saudi Arabia has increased tensions in the energy market and turned into a long-term risk factor. Against this backdrop, global central banks are becoming less hawkish, while elevated debt pressure continues to weigh on the global economy. In these conditions, retail investors remain interested in safe-haven assets, but many increasingly prefer longer-dated and more reliable government bonds, whose yields have been testing multi-decade highs for a prolonged period. At present, the yield on benchmark 10-year Treasuries stands at 5.206%, close to a 25-year high, and no meaningful decline is expected for now, triggering capital outflows from gold and limiting upside in the precious metal.
Nevertheless, in the long term, gold continues to hold strong positions, which prevents a deeper decline. According to the latest data from the US Commodity Futures Trading Commission (CFTC), 210.3 thousand net speculative positions were open this week, slightly below 218.6 thousand a week earlier but still well above the 130.0 thousand recorded during the same period last year. Meanwhile, according to CME Group, 124.4 thousand futures contracts and 31.4 thousand options contracts were registered on October 13, marking the lowest trading volume seen in both October and September.
As noted in our previous XAU/USD forecast, gold remains highly sensitive to movements in Treasury yields and geopolitical developments, while sustained pressure from the bond market continues to cap the upside.
Support and resistance levels
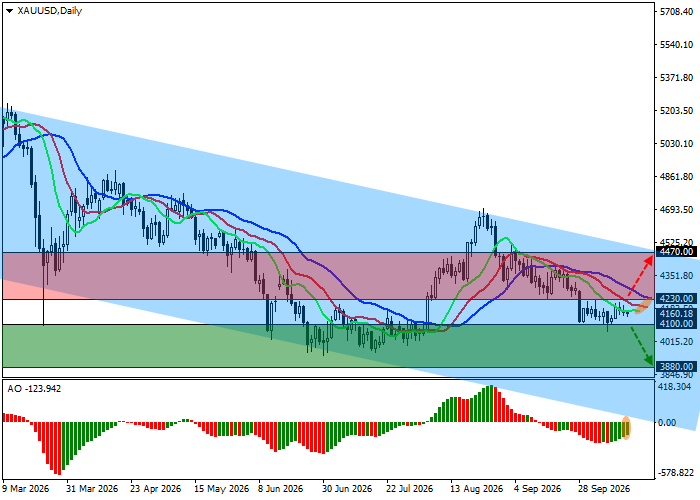
On the daily chart, the trading instrument is correcting well below the resistance line of a global descending channel with dynamic boundaries of 4500.0–3700.0.
Technical indicators are strengthening the sell signal: the fast EMAs of the Alligator indicator remain below the slow ones, while the AO histogram is forming corrective bars in the negative zone.
Support levels: 4100.0, 3880.0.
Resistance levels: 4230.0, 4470.0.
Trading scenarios and forecast for XAU/USD
Short positions may be opened after the price declines and consolidates below 4100.0, with the target at 3880.0. Stop-loss — 4190.0. Timeframe: 7 days or more.
Long positions may be opened after the price rises and consolidates above 4230.0, with the target at 4470.0. Stop-loss — 4130.0.
Scenario
| Timeframe | Weekly |
| Recommendation | SELL STOP |
| Entry point | 4100.0 |
| Take Profit | 3880.0 |
| Stop Loss | 4190.0 |
| Key levels | 3880.0, 4100.0, 4230.0, 4470.0 |
Alternative scenario
| Recommendation | BUY STOP |
| Entry point | 4230.0 |
| Take Profit | 4470.0 |
| Stop Loss | 4130.0 |
| Key levels | 3880.0, 4100.0, 4230.0, 4470.0 |
