

On the daily chart, the price remains above the support line of a local ascending channel with dynamic boundaries at 184.00–163.00.
On the four-hour chart, the stock is approaching the resistance line of the trading range following a correction and appears ready to resume its upward movement. However, if the price consolidates below the local support level of the current trend at 172.00, the asset could return toward the 160.00 area.
Technical indicators maintain a buy signal: the fast EMAs of the Alligator indicator remain significantly above the slow ones, while the Awesome Oscillator (AO) histogram is forming corrective bars in positive territory.
The outlook for energy stocks also remains closely linked to developments in the oil market. As discussed in our recent Brent crude oil forecast, escalating geopolitical tensions in the Persian Gulf continue to support crude prices, potentially providing a favourable backdrop for major oil producers such as ExxonMobil.
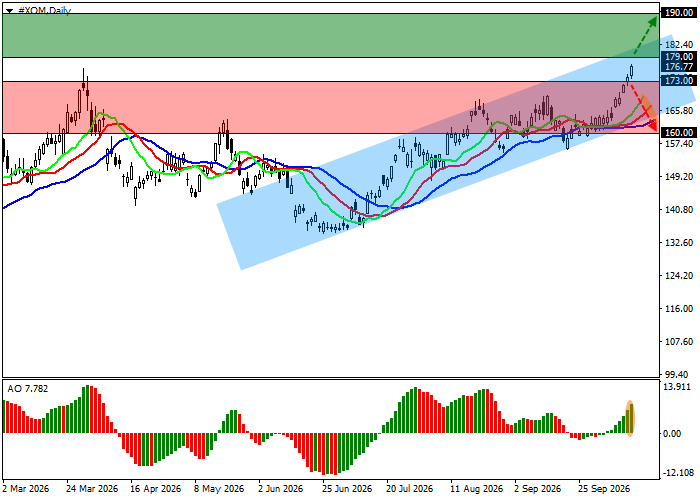
ExxonMobil stock trading scenarios and XOM price forecast
Long positions may be opened after the price rises and consolidates above 179.00, with a target at 190.00. Stop-loss — 170.00. Estimated implementation period: 7 days or more.
Short positions may be opened after the price declines and consolidates below 173.00, with a target at 160.00. Stop-loss — 180.00.
Scenario
| Timeframe | Weekly |
| Recommendation | BUY STOP |
| Entry point | 179.00 |
| Take Profit | 190.00 |
| Stop Loss | 170.00 |
| Key levels | 160.00, 173.00, 179.00, 190.00 |
Alternative scenario
| Recommendation | SELL STOP |
| Entry point | 173.00 |
| Take Profit | 160.00 |
| Stop Loss | 180.00 |
| Key levels | 160.00, 173.00, 179.00, 190.00 |
