

Tomorrow at 03:00 (GMT+2), the US president will address the nation and may clarify details of the country’s exit strategy from the conflict. It is worth noting that winding down the operation does not imply signing a peace agreement with Tehran or reopening the Strait of Hormuz. Investors reacted to these statements with cautious optimism, as the future course of events in the Middle East remains uncertain: the Islamic Republic may reject a peaceful settlement without security guarantees and reparations, while its continued control over the key maritime route would still complicate oil transportation even if a permit-based system for tanker passage is introduced.
In addition, prices were supported by recent comments from Federal Reserve Chair Jerome Powell, who said during a speech at Harvard on Monday that inflation expectations remain stable and that, since monetary policy adjustments affect the economy with a lag, tighter credit conditions would not be effective at the moment. Following his remarks, market estimates of the probability of a rate hike this year dropped from 50.0% to 2.0%.
Nevertheless, the pound’s positive dynamics appear fragile, as the UK economy continues to slow significantly: in the fourth quarter, gross domestic product (GDP) rose by 0.1% quarter-on-quarter, while annual growth slowed from 1.2% to 1.0%. Experts fear that, given the consequences of hostilities in the Persian Gulf, Bank of England officials may abandon hawkish rhetoric and move toward monetary easing to avoid a recession. The regulator’s financial stability report published today confirms that a continuation of the conflict will increase inflation and raise the likelihood of simultaneous risks in sovereign debt and private credit markets.
Overall, fundamental factors continue to point to further downside in GBP/USD despite the correction.
Support and resistance levels
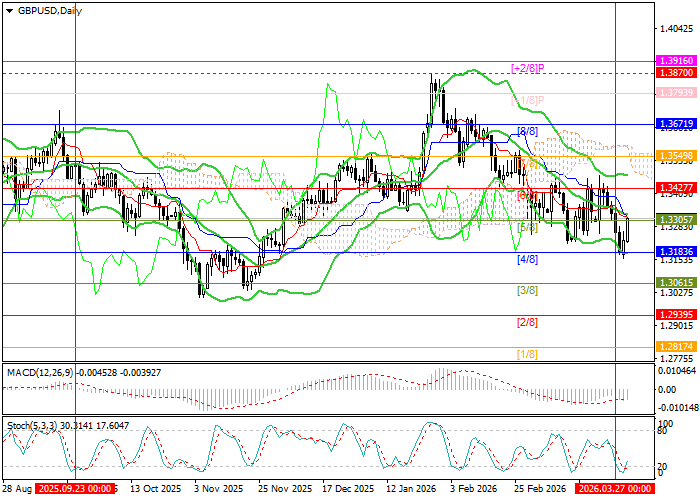
The trading instrument has returned to the middle Bollinger Band at 1.3307 (Murray [5/8]), but in order to reverse the bearish trend, prices need to consolidate above 1.3427 (Murray [6/8]). In that case, further growth toward 1.3671 (Murray [8/8]) and 1.3870 (the area of January highs) may follow. However, if the pair breaks below the lower Bollinger Band at 1.3183 (Murray [4/8]), a decline toward 1.2939 (Murray [2/8]) and 1.2817 (Murray [1/8]) is likely.
Technical indicators maintain a sell signal: Bollinger Bands are turning downward, the MACD histogram remains stable in negative territory, and Stochastic has turned upward from the oversold zone, which does not rule out a limited correction.
Resistance levels: 1.3427, 1.3671, 1.3870.
Support levels: 1.3183, 1.2939, 1.2817.
Trading scenarios and GBP/USD forecast
Short positions may be opened below 1.3183 with targets at 1.2939 and 1.2817 and a stop-loss at 1.3370. Timeframe: 5–7 days.
Long positions may be opened above 1.3427 with targets at 1.3671 and 1.3870 and a stop-loss at 1.3350.
Scenario
| Timeframe | Weekly |
| Recommendation | SELL STOP |
| Entry point | 1.3180 |
| Take Profit | 1.2939, 1.2817 |
| Stop Loss | 1.3370 |
| Key levels | 1.2817, 1.2939, 1.3183, 1.3427, 1.3671, 1.3870 |
Alternative scenario
| Recommendation | BUY STOP |
| Entry point | 1.3430 |
| Take Profit | 1.3671, 1.3870 |
| Stop Loss | 1.3350 |
| Key levels | 1.2817, 1.2939, 1.3183, 1.3427, 1.3671, 1.3870 |
