

US media projected that Democrats had won majorities in both chambers of Congress, and Vice President JD Vance attributed the Republican setback to the war with Iran. The election outcome raised expectations that the White House would face greater pressure to pursue a diplomatic settlement. Traders reduced some of the premium they had been paying to account for potential supply disruptions, a risk that supported prices in our previous WTI oil forecast.
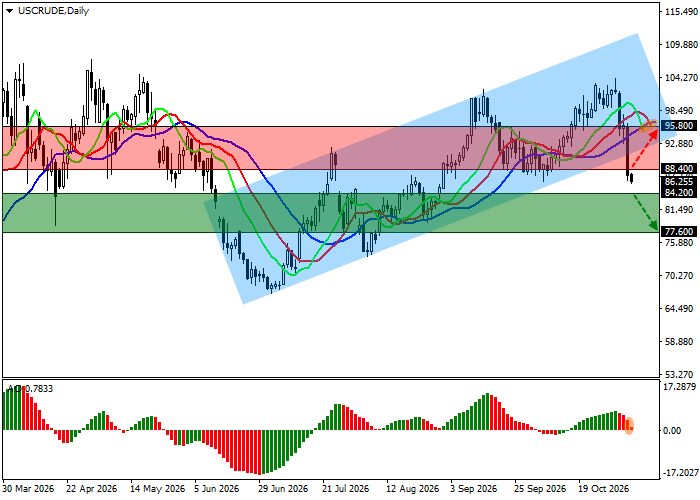
The recovery from the early low shows how quickly prices can move as those expectations shift. The outlook for Gulf exports still depends on progress in negotiations and the security of shipments through the Strait of Hormuz. On the chart, the rebound brought WTI back to the $88.40 resistance area, where a sustained move above the level would give the recovery more weight.
US commercial crude oil inventories, excluding the Strategic Petroleum Reserve, fell by 865,000 barrels to 409.8 million barrels in the week ended October 30, following a draw of 1.892 million barrels the previous week. The American Petroleum Institute estimated a larger draw of 5.267 million barrels after a decline of 2.031 million barrels a week earlier. The November 4 release is available in the EIA Weekly Petroleum Status Report archive.
CME Group recorded trading volume of 1,134,482 WTI futures contracts on November 3, up from 1,039,681 the previous session. Volume across the crude oil options products tracked in its daily report totalled 185,800 contracts on November 3.
Support and Resistance Levels
On the daily chart, WTI remains below the lower boundary of the former ascending channel, which spans 90.00–111.00.
The technical bias remains bearish. The Alligator indicator's faster exponential moving averages (EMAs) are below the slower ones, while the Awesome Oscillator (AO) histogram is forming corrective bars farther from the zero line.
Support levels: 84.20, 77.60.
Resistance levels: 88.40, 95.80.
WTI Crude Oil Trading Scenarios and Price Forecast
A sustained break below 84.20 could support a short position targeting 77.60, with a stop-loss at 87.00. The estimated holding period is seven days or more.
If the price breaks and holds above 88.40, a long position could target 95.80, with a stop-loss at 85.00.
Scenario
| Timeframe | Weekly |
| Recommendation | SELL STOP |
| Entry Point | 84.20 |
| Take Profit | 77.60 |
| Stop Loss | 87.00 |
| Key Levels | 77.60, 84.20, 88.40, 95.80 |
Alternative Scenario
| Recommendation | BUY STOP |
| Entry Point | 88.40 |
| Take Profit | 95.80 |
| Stop Loss | 85.00 |
| Key Levels | 77.60, 84.20, 88.40, 95.80 |
