

The US Federal Reserve's interest rate currently stands at 3.75–4.00%, where it is likely to remain until December, despite rising inflation and signals from some Fed officials suggesting the need for monetary tightening in response to price pressures. The possibility of higher borrowing costs by the end of the year is also supported by the high probability of another acceleration in inflation, potentially driven by instability in energy supplies and rising oil prices, which remain above the 110.00 mark. According to the Chicago Mercantile Exchange (CME) FedWatch Tool, the probability of monetary tightening on October 28 is currently only 9.4%, compared to 76.3% in December. Macroeconomic statistics have had little impact on the US dollar, as nearly all indicators remain close to their previous levels. In addition, market participants will closely monitor the conflict in the Persian Gulf region, where the likelihood of a resolution has declined significantly following reports of the arrival of a third US aircraft carrier strike group.
Overall, the US dollar is expected to show neutral to moderately positive performance over the next quarter, while the Swiss franc is likely to weaken, potentially driving the USD/CHF pair higher.
Technical indicators continue to signal buying opportunities: on the weekly chart, the price has repeatedly reached the support line within the global broadening formation pattern, with dynamic boundaries at 0.9300–0.7400, and is now attempting to extend its upward movement.
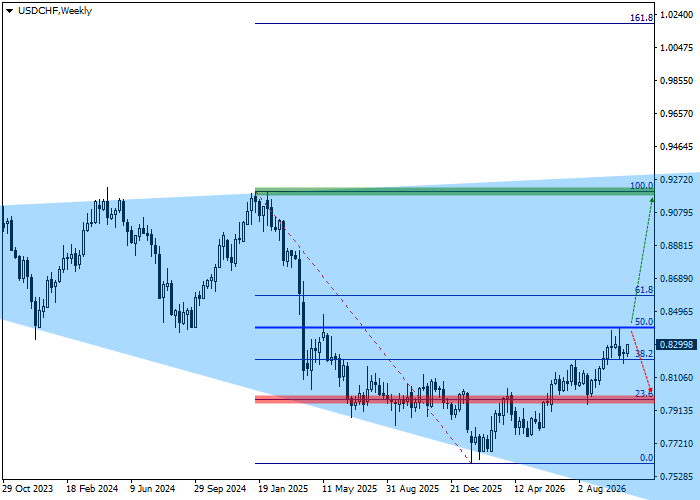
After testing the global support level at 0.7610, the price reversed and began forming a steady upward rebound, which could subsequently be supported by fundamental factors. Additional support comes from a strong concentration of trading volume around the previously breached local high of 0.8200, which has been observed since early summer 2025.
We suggest examining the key levels on the daily timeframe.
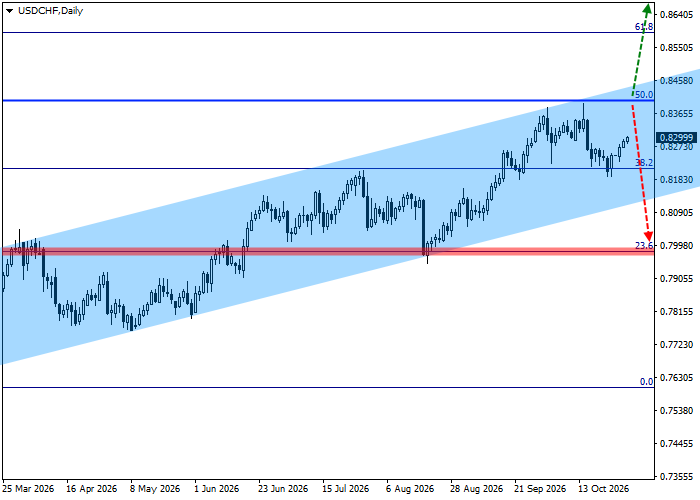
As shown on the chart, the price has failed to break out of the global pattern and is attempting to consolidate above the local high of 0.8400. Once this level is secured, the upward movement is expected to continue in a new bullish wave above the resistance line of the local ascending channel, with boundaries at 0.8500–0.8100. If the asset reaches the 100.0% Fibonacci retracement level at 0.9200, profits on existing long positions should be taken. However, if the price declines towards the initial 23.6% Fibonacci retracement level at 0.8200, open long positions should be closed.
The entry point should be assessed on the four-hour timeframe.
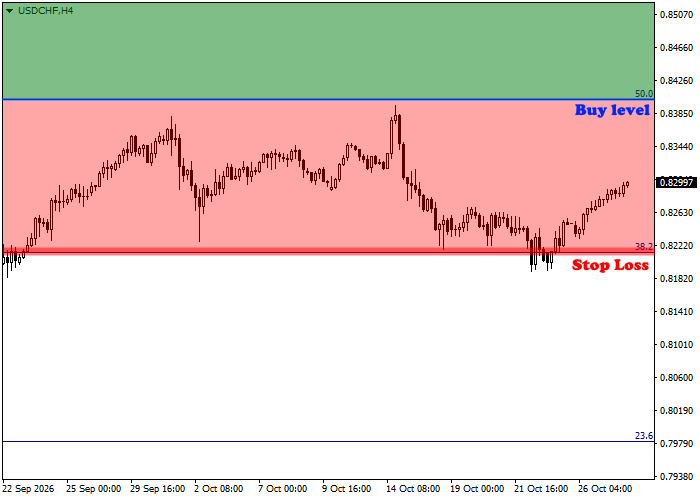 The entry point for long positions is located at 0.8400 (the intermediate 50.0% Fibonacci retracement level). Once the price consolidates above this mark, there will be virtually no significant resistance preventing further growth, making it possible to execute buy positions.
Considering the asset's average daily volatility over the past month, which stands at 33.4 points, the price movement towards the target zone of 0.9200 could take approximately 60 trading sessions. However, if volatility increases, this period could be reduced to 49 trading days.
