

The USD/JPY pair is exhibiting mixed momentum this week, having briefly touched 148.82 before retracing gains as traders position ahead of two critical central bank meetings. Both the U.S. Federal Reserve (FOMC) and the Bank of Japan (BoJ) are expected to keep monetary policy unchanged, with investors instead scrutinizing forward guidance for clues on future rate adjustments.
U.S. inflation accelerated in June, with CPI at 2.7% and core CPI at 2.9%, reflecting the impact of higher trade tariffs. Labor market conditions remain robust—unemployment has held between 4.1% and 4.2%, and job creation continues apace. This backdrop makes a dovish shift by the Fed unlikely, even as President Trump maintains pressure for policy easing. The consensus is for the FOMC to voice concern about inflation risks but leave the door open for one or two rate cuts by year-end, depending on incoming data and the outcome of U.S.-China trade negotiations.
In Japan, the BoJ is balancing elevated inflation (June CPI at 3.3%, well above the 2.0–3.0% target) with headwinds in the industrial sector, exacerbated by U.S. tariffs on autos. While the manufacturing slowdown is partly offset by resilience in services, the overall economic outlook remains fragile. Policy rates are likely to stay on hold, though officials may hint at a readiness to adjust if conditions deteriorate further.
Technical Analysis: Key Levels and Scenarios
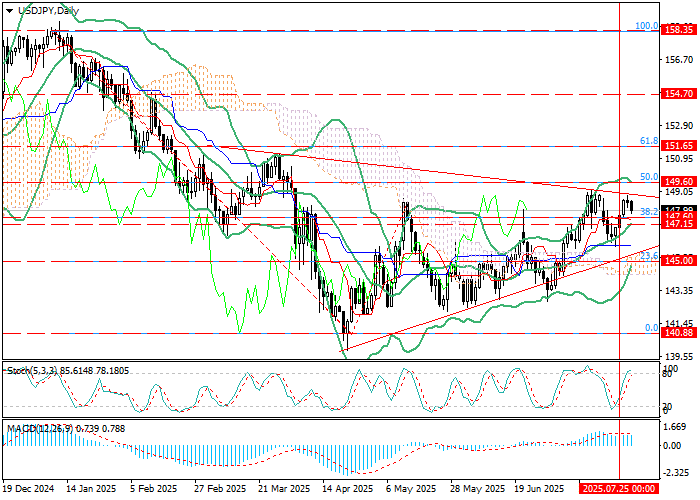
Technically, USD/JPY is trading within a symmetrical triangle, currently testing resistance near the upper boundary. A decisive breakout above 149.60 (50% Fibonacci retracement) could unlock upside targets at 151.65 (61.8% Fib) and 154.70. On the downside, a sustained move below the Bollinger midline at 147.15 would reinforce a corrective scenario toward 145.00 (23.6% Fib) and ultimately 140.88 (full retracement).
The indicator setup points to continued bullish potential: Bollinger Bands are angled upward, MACD is holding in positive territory, and the Stochastic oscillator is approaching overbought conditions, suggesting any pullback could be shallow and short-lived.
- Resistance levels: 149.60, 151.65, 154.70
- Support levels: 147.15, 145.00, 140.88
Trading Scenarios
Bullish scenario: Consider long positions on a break above 149.60, targeting 151.65 and 154.70, with a stop-loss at 148.30. (Time frame: 5–7 days)
Bearish scenario: Short trades may be initiated below 147.15, targeting 145.00 and 140.88, with a stop at 148.70.
| Timeframe | Action | Entry | Take Profit | Stop Loss | Key Levels |
|---|---|---|---|---|---|
| Weekly | BUY STOP | 149.60 | 151.65, 154.70 | 148.30 | 140.88, 145.00, 147.15, 149.60, 151.65, 154.70 |
| Weekly | SELL STOP | 147.15 | 145.00, 140.88 | 148.70 | 140.88, 145.00, 147.15, 149.60, 151.65, 154.70 |
