

The index remains under pressure from signs of slowing activity in key sectors of the Australian economy, with Brent crude oil prices holding above $100.00 per barrel amid heightened geopolitical tensions in the Persian Gulf. Energy supply disruptions and rising airfares are adding to business costs, while the latest labour market data indicate a slowdown in employment. In September, the unemployment rate stood at 4.7%, exceeding forecasts of 4.6% and remaining unchanged from the upwardly revised August figure. Employment declined by 39.3K, compared with expectations of a 19.6K increase and the previous month's revised gain of 29.3K. Meanwhile, the labour force participation rate fell from 67.0% to 66.8%, against forecasts of 67.0%. These developments highlight growing pressure on the domestic economy, although the local equity market has managed to recover some of its recent losses, following the correction discussed in our previous ASX 200 forecast.
Another important factor for the market is uncertainty surrounding further monetary tightening by the Reserve Bank of Australia (RBA) at its early November meeting. The current interest rate stands at 4.60%, and an additional increase of 25 basis points would bring it to 4.85%, widening the interest rate differential with the United States if the Federal Reserve leaves borrowing costs unchanged. However, following the weaker-than-expected employment report, market expectations of a November rate hike declined sharply, with traders assigning a probability of approximately 10.0% to such a decision. Meanwhile, Australian government bond yields are also correcting as investors reassess the outlook for monetary policy and increase demand for fixed-income securities. The yield on short-term one-year bonds is trading near 4.890%, below last Friday's 4.930%. The benchmark 10-year government bond yield declined from 5.352% at the end of last week to approximately 5.242%, while the 20-year yield decreased from 5.727% to 5.612%, and the 30-year yield fell from 5.812% to 5.687%.
Among the leading gainers in the index are WiseTech Global Ltd. (+8.32%), Life360 Inc. (+7.45%), Paladin Energy Ltd. (+5.93%), Pro Medicus Ltd. (+7.43%) and Centuria Capital Group (+6.64%).
The biggest declines were recorded by Cleanaway Waste Management Ltd. (–5.32%), Generation Development Group Ltd. (–5.10%), Champion Iron Ltd. (–2.06%), Viva Energy Group Ltd. (–2.34%) and Fletcher Building Ltd. (–1.14%).
Support and resistance levels
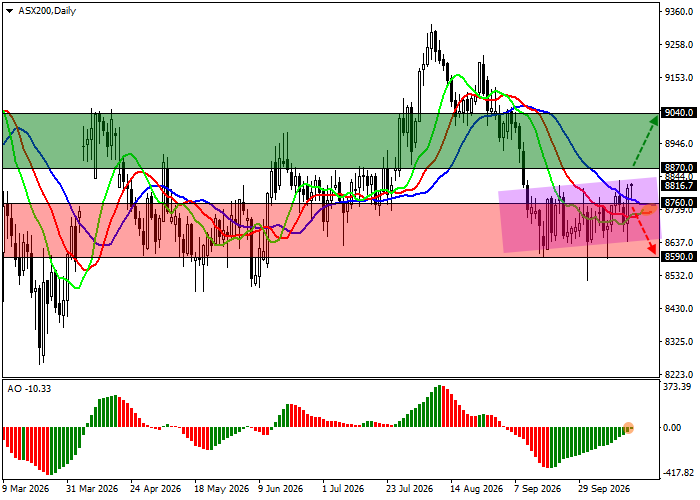
On the daily chart, the trading instrument remains slightly below the resistance line of the recently formed ascending channel with dynamic boundaries at 8850.0–8640.0.
Technical indicators are weakening their sell signal: the fast exponential moving averages (EMAs) of the Alligator indicator remain below the slow ones, while the Awesome Oscillator (AO) histogram is forming corrective bars in negative territory.
Support levels: 8760.0, 8590.0.
Resistance levels: 8870.0, 9040.0.
ASX 200 Trading Scenarios and Index Forecast
Long positions may be opened after the price rises and consolidates above 8870.0, with a target at 9040.0 and a stop-loss at 8790.0. Estimated implementation period: 7 days or more.
Short positions may be opened after the price declines and consolidates below 8760.0, with a target at 8590.0. Stop-loss: 8860.0.
Scenario
| Timeframe | Weekly |
| Recommendation | BUY STOP |
| Entry Point | 8870.0 |
| Take Profit | 9040.0 |
| Stop Loss | 8790.0 |
| Key Levels | 8590.0, 8760.0, 8870.0, 9040.0 |
Alternative Scenario
| Recommendation | SELL STOP |
| Entry Point | 8760.0 |
| Take Profit | 8590.0 |
| Stop Loss | 8860.0 |
| Key Levels | 8590.0, 8760.0, 8870.0, 9040.0 |
