

Meanwhile, according to the Swiss Federal Statistical Office (FSO), the overall Producer and Import Price Index increased by 0.3% in September to 100.7 points. The largest price increases were recorded for computers, petroleum products, crude oil and natural gas, as well as motor vehicles and their parts. However, the index declined by 0.2% year-on-year. The rise in import prices was mainly driven by higher costs of petroleum products, crude oil and natural gas, and motor vehicles. Price increases were also observed in other product categories, including basic metals, semi-finished metal products, leather goods and travel accessories.
The US Dollar Index (USDX) has retreated toward 101.77 as investors reassess the outlook for Federal Reserve monetary policy amid increased volatility in US technology stocks and ongoing geopolitical uncertainty in the Persian Gulf. Moreover, stronger-than-expected US inflation data initially increased expectations of additional monetary tightening. According to the Chicago Mercantile Exchange (CME) FedWatch Tool, the probability of an interest rate hike in October briefly rose toward 40.0%. However, this probability subsequently declined after members of the Federal Open Market Committee (FOMC) indicated that there was no urgent need to tighten monetary policy and that further economic data should be assessed before the next meeting. By October 16, markets were assigning approximately an 87.0% probability to the Federal Reserve keeping interest rates unchanged this month. Expectations of further monetary tightening in December remain significant, although the outlook continues to depend on incoming economic data and statements from Fed officials.
Support and resistance levels
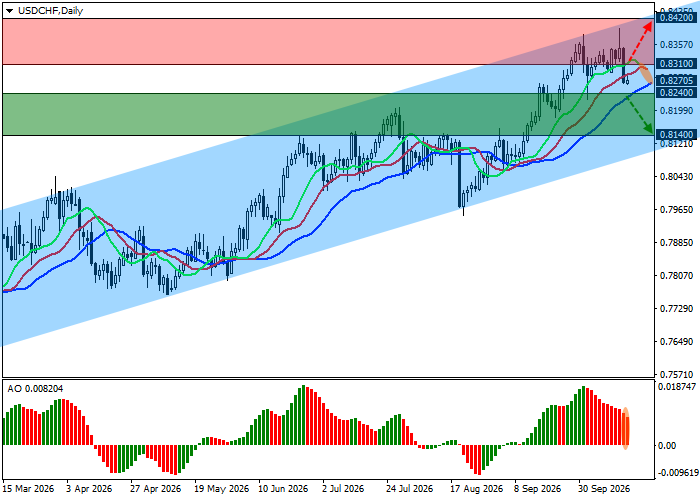
On the daily chart, the trading instrument remains significantly above the support line of a stable ascending channel with dynamic boundaries at 0.8430–0.8100. The broader upward trend was also discussed in our previous USD/CHF forecast.
Technical indicators have weakened their buy signal: the fast exponential moving averages (EMAs) of the Alligator indicator are approaching the slow ones from above, while the Awesome Oscillator (AO) histogram is forming corrective bars in positive territory.
Support levels: 0.8240, 0.8140.
Resistance levels: 0.8310, 0.8420.
USD/CHF Trading Scenarios and Exchange Rate Forecast
Short positions may be opened after the price declines and consolidates below 0.8240, with a target at 0.8140. Stop-loss: 0.8320. Estimated implementation period: 7 days or more.
Long positions may be opened after the price rises and consolidates above 0.8310, with a target at 0.8420. Stop-loss: around 0.8230.
Scenario
| Timeframe | Weekly |
| Recommendation | SELL STOP |
| Entry Point | 0.8240 |
| Take Profit | 0.8140 |
| Stop Loss | 0.8320 |
| Key Levels | 0.8140, 0.8240, 0.8310, 0.8420 |
Alternative Scenario
| Recommendation | BUY STOP |
| Entry Point | 0.8310 |
| Take Profit | 0.8420 |
| Stop Loss | 0.8230 |
| Key Levels | 0.8140, 0.8240, 0.8310, 0.8420 |
