

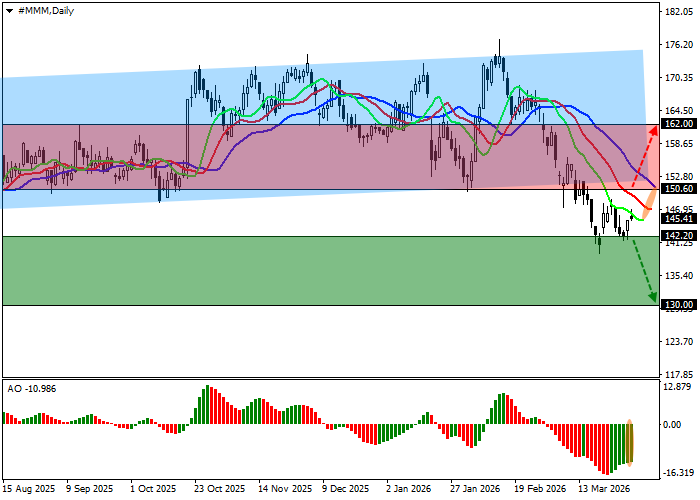
On the daily chart, the instrument is holding slightly below the support line of an ascending channel with dynamic boundaries at 176.00–151.00.
On the four-hour timeframe, the breakout from the range has already occurred, and in the near term the price may again attempt to move away from the support line located around 150.00. However, a full reversal cannot be ruled out, as well as a return to the 162.00 high followed by its retest. At the same time, confidence in strengthening bearish momentum is supported by the fact that the local low at 140.00 has already been reached, with a break below this level currently seen as the priority target.
Technical indicators are ready to strengthen the sell signal following a local correction: fast EMAs on the Alligator indicator are positioned slightly below the signal line and are moving further away from it again, while the AO histogram is forming corrective bars below the transition level.
Trading scenarios and 3M Co. price forecast
Short positions should be opened after the price consolidates below 142.20 with a target at 130.00. Stop-loss — 150.00. Implementation period: 7 days or more.
Long positions should be opened after consolidation above 150.60 with a target at 162.00. Stop-loss — 145.00.
Scenario
| Timeframe | Weekly |
| Recommendation | SELL STOP |
| Entry Point | 142.15 |
| Take Profit | 130.00 |
| Stop Loss | 150.00 |
| Key Levels | 130.00, 142.20, 150.60, 162.00 |
Alternative Scenario
| Recommendation | BUY STOP |
| Entry Point | 150.65 |
| Take Profit | 162.00 |
| Stop Loss | 145.00 |
| Key Levels | 130.00, 142.20, 150.60, 162.00 |
3M shares remain in a zone of uncertainty, where key support levels will determine the next move. A break below 142.20 would strengthen bearish momentum and open the path toward 130.00. At the same time, a return above 150.60 may shift sentiment back in favor of buyers.
