

Market expectations are high ahead of the upcoming earnings report. Consensus estimates put Q2 revenue at $162.05B, above both the $155.70B recorded in the previous quarter and $147.98B posted a year earlier. Earnings per share (EPS) are forecast to reach $1.32, compared to $1.59 in Q1 and $1.26 in Q2 last year. If realized, these numbers would confirm Amazon’s ability to maintain top-line growth despite ongoing macroeconomic and geopolitical headwinds.
Technical Analysis: Support and Resistance
On the daily chart, Amazon stock remains in a clear uptrend, currently consolidating just below the channel resistance at $233.00, with dynamic channel boundaries stretching from $205.00 to $240.00. Technical indicators remain firmly in “buy” territory: the expanding range of the EMA underscores persistent bullish momentum, while the AO histogram is nearing the zero line, forming new corrective bars—potentially signaling further upside.
- Support levels: $220.00, $198.00
- Resistance levels: $233.00, $250.00
Trading Scenarios
Bullish Scenario: If the price breaks above the $233.00 resistance and sustains momentum, long positions become attractive with a target of $250.00. Suggested stop-loss is set at $225.00. The implementation horizon is 7 days or longer.
Bearish Scenario: Should a reversal occur and the price consolidate below the $220.00 support, short positions may be considered with a target of $198.00. Suggested stop-loss is $230.00.
Weekly Chart Trading Plan
- BUY STOP: Entry at $233.05, Take Profit $250.00, Stop Loss $225.00
- SELL STOP: Entry at $219.95, Take Profit $198.00, Stop Loss $230.00
- Key Levels: $198.00, $220.00, $233.00, $250.00
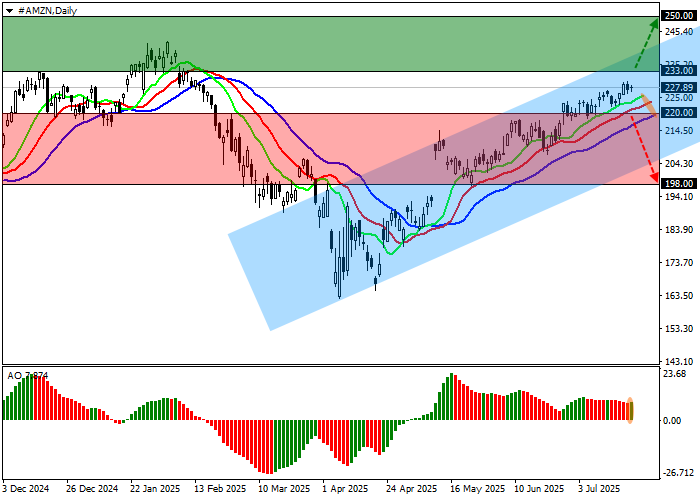 Amazon stock near resistance