

The company is set to release its Q1 2026 earnings report on April 15. Revenue is expected to decline compared to the same period last year, when it reached 34.07 billion dollars, and may come in around 29.76 billion dollars. At the same time, earnings per share (EPS) are projected at 0.996 dollars, above the previous 0.900 dollars. According to preliminary data, net interest income increased by at least 7.0% year-over-year, investment banking revenues rose by 10.0%, and trading revenues grew by 9.0%. In addition, management reported a 3.8% year-over-year increase in US credit card spending in February, marking the ninth consecutive month of growth, although on a monthly basis the indicator declined by 5.4%, slightly worse than typical seasonal trends.
Recently, the company redeemed 27.8 billion in senior bonds with fixed and floating rates of 0.543%. The next dividend payment is scheduled for March 27, when investors will receive 0.28 dollars per share, corresponding to a yield of 2.25%, slightly below the sector average of 3.16%.
Support and resistance levels
On the daily chart, the instrument is trading below the support line of a local upward channel with boundaries at 59.00–52.00.
Technical indicators maintain an unstable sell signal: the Alligator indicator range is expanding downward, fast EMAs remain below the signal line, and the AO histogram is forming descending bars in negative territory.
Resistance levels: 48.50, 53.00.
Support levels: 45.50, 41.80.
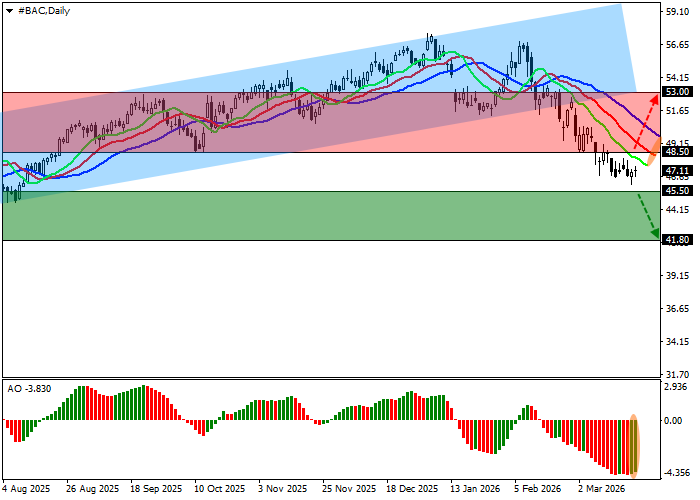
Trading scenarios and Bank of America Corp. outlook
Short positions may be considered after a breakdown and закрепление below 45.50 with a target at 41.80. Stop-loss — above 47.50. Implementation period: 7 days or more.
Long positions may be considered after a breakout and закрепление above 48.50 with a target at 53.00 and a stop-loss at 46.00.
Scenario
| Timeframe | Weekly |
| Recommendation | SELL STOP |
| Entry point | 45.45 |
| Take Profit | 41.80 |
| Stop Loss | 47.50 |
| Key levels | 41.80, 45.50, 48.50, 53.00 |
Alternative scenario
| Recommendation | BUY STOP |
| Entry point | 48.55 |
| Take Profit | 53.00 |
| Stop Loss | 46.00 |
| Key levels | 41.80, 45.50, 48.50, 53.00 |
