

Most analysts note that the asset’s dynamics depend on global hydrocarbon prices. Since the beginning of the week, WTI Crude Oil has corrected from a local high of 103.70 to 93.76, while the issuer’s shares declined from 176.00 to 162.00, marking the sharpest drop since April 2025. Despite the Strait of Hormuz — through which, prior to the escalation of the U.S.–Iran conflict, 20.0% of global oil and 30.0% of liquefied natural gas (LNG) shipments passed — remaining blocked, Tehran is allowing tankers bound for China, India, and several BRICS countries to pass. This somewhat reduces sector tensions, and if the regional situation normalizes, the downward movement may continue.
The first-quarter earnings report will be released on April 24 and may reflect revenue changes from 82.31 billion$ to 80.70 billion$, compared to 83.13 billion$ in the same period last year, while earnings per share (EPS) are expected to increase from 1.71$ to 1.76$, roughly in line with last year’s level. The date of the third indexed quarterly dividend payment has not yet been confirmed, but it is expected to amount to 1.03$ per share. Considering annual increases, dividend yield may reach approximately 2.75%, still below the sector average of 4.94%, but higher than the 2.65% recorded in the latest transaction on March 10.
Support and Resistance Levels
On the daily chart, the price is approaching the support line of an ascending channel with dynamic boundaries at 176.00–156.00.
Technical indicators are weakening the buy signal: the AO histogram is forming corrective bars, while fast EMAs of the Alligator indicator remain above the signal line.
Resistance levels: 166.00, 176.00.
Support levels: 157.00, 146.00.
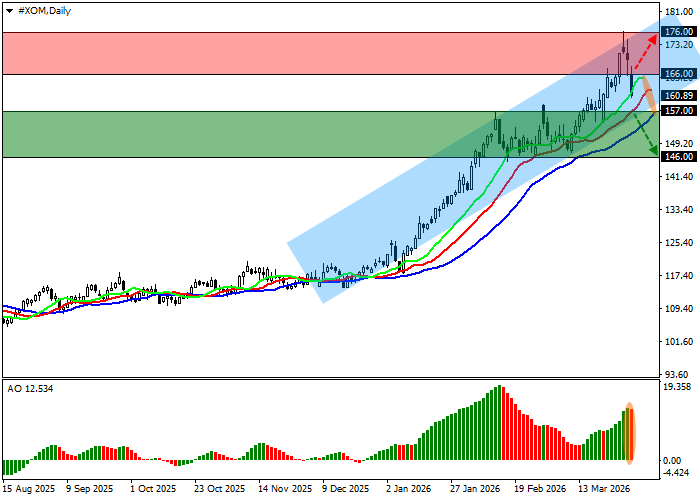
Trading scenarios and ExxonMobil price forecast
Short positions can be opened after the price declines and consolidates below 157.00 with a target at 146.00 and stop-loss at 164.00. Implementation period: 7 days or more.
Long positions can be opened after growth and consolidation above 166.00 with a target at 176.00. Stop-loss — 160.00.
Scenario
| Timeframe | Weekly |
| Recommendation | SELL STOP |
| Entry Point | 156.95 |
| Take Profit | 146.00 |
| Stop Loss | 164.00 |
| Key Levels | 146.00, 157.00, 166.00, 176.00 |
Alternative Scenario
| Recommendation | BUY STOP |
| Entry Point | 166.05 |
| Take Profit | 176.00 |
| Stop Loss | 160.00 |
| Key Levels | 146.00, 157.00, 166.00, 176.00 |
