

Over the past month, 80% of the few oil tankers leaving the waterway were either Iranian or belonged to countries maintaining friendly relations. According to The Wall Street Journal, representatives of the Republican administration in the White House are carefully assessing the risks of a military scenario that could escalate the conflict. Analysts note that a ground operation carries high risks of human losses and increased military spending (the Pentagon has approved the deployment of approximately 10,000 troops, including 2,200 Marines and forces from the elite 82nd Airborne Division). However, the “hawkish” rhetoric of White House officials and representatives of the Ansar Allah movement, ready to join combat operations, increases market uncertainty. Nevertheless, even small signals of potential peaceful resolution act as a driver for strengthening the FTSE 100 index. An additional positive factor is the reluctance of European allies, including the UK, France, and Italy, to participate in a military operation against Iran, highlighting ongoing divisions within the Western bloc.
British stocks were further supported by recent macroeconomic reports. The UK economy grew by 0.1% in Q4, in line with analysts’ initial estimates, while the GDP for 2025 was revised from 1.3% to 1.4%, largely due to rising real estate prices observed since mid-autumn last year (up 0.9% in March).
The expected reaction to the local capital inflow into equities amid reduced geopolitical tension is a correction in bond yields. Short-term one-year bonds are trading at 4.379%, slightly down from 4.476% previously; 10-year bonds at 4.918% versus 4.983%; and 20-year and 30-year bonds at 5.477% and 5.522%, compared with 5.542% and 5.589%, respectively.
Top gainers in the index include Antofagasta plc (+5.25%), Endeavour Mining plc (+4.25%), Fresnillo plc (+4.10%), and Metlen Energy & Metals plc (+4.05%).
Top decliners include Unilever plc (–7.28%), IMI plc (–2.39%), Croda International plc (–1.85%), and Diageo plc (–1.62%).
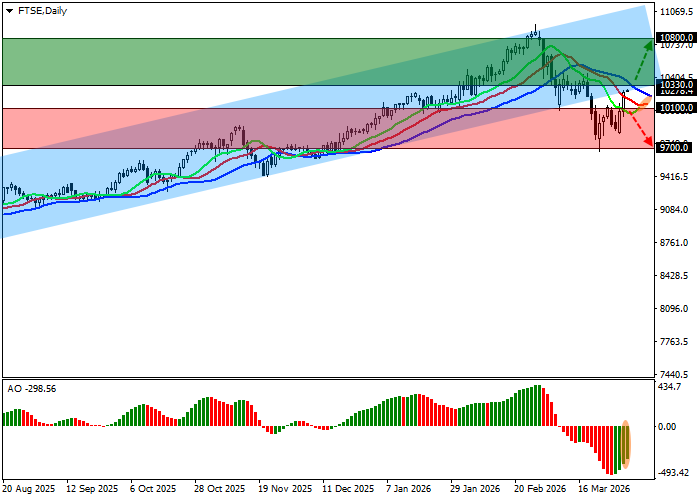
Support and Resistance Levels
On the daily chart, the instrument is again attempting to break through the resistance line of the descending channel at 10000.0–9700.0.
Technical indicators show a stable sell signal, which weakens amid the local correction: the EMA range on the Alligator indicator gradually narrows, and the AO histogram is forming new corrective bars below the crossover level.
Support levels: 10100.0, 9700.0.
Resistance levels: 10330.0, 10800.0.
Trading Scenarios and FTSE 100 Forecast
Long positions should be opened after the price consolidates above 10330.0, targeting 10800.0 with a stop loss at 10100.0. Timeframe: 7 days or more.
Short positions should be opened after the price consolidates below 10100.0, targeting 9700.0 with a stop loss at 10250.0.
Scenario
| Timeframe | Weekly |
| Recommendation | BUY |
| Entry Point | 10348.7 |
| Take Profit | 10800.0 |
| Stop Loss | 10100.0 |
| Key Levels | 9700.0, 10100.0, 10330.0, 10800.0 |
Alternative Scenario
| Recommendation | SELL STOP |
| Entry Point | 10099.5 |
| Take Profit | 9700.0 |
| Stop Loss | 10250.0 |
| Key Levels | 9700.0, 10100.0, 10330.0, 10800.0 |
