

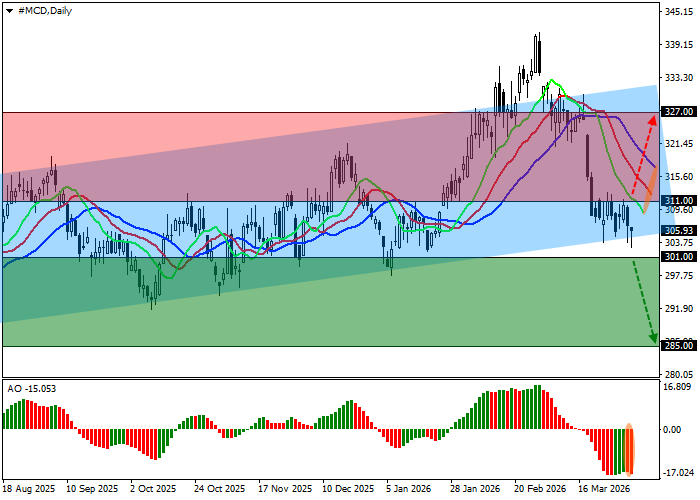
On the daily chart, the instrument is holding near the support line of the local ascending channel at 335.00–303.00, forming a new corrective wave.
On the four-hour timeframe, bullish momentum has noticeably weakened after an unsuccessful attempt to return to upward dynamics, while the support line at 304.00 remains close to the current price. Additional confirmation of strengthening bearish pressure comes from the fact that the instrument has firmly consolidated below last year’s highs around 315.00.
Technical indicators are actively reinforcing a relatively stable sell signal: fast EMAs on the Alligator indicator remain below the signal line, while the AO histogram forms new bars below the transition level.
Trading Scenarios and McDonald’s Corp. Forecast
Short positions may be opened after the price consolidates below 301.00 with a target at 285.00. Stop-loss — 310.00. Implementation period: 7 days or more.
Long positions may be opened after the price consolidates above 311.00 with a target at 327.00. Stop-loss — 304.00.
Scenario
| Timeframe | Weekly |
| Recommendation | SELL STOP |
| Entry Point | 300.95 |
| Take Profit | 285.00 |
| Stop Loss | 310.00 |
| Key Levels | 285.00, 301.00, 311.00, 327.00 |
Alternative Scenario
| Recommendation | BUY STOP |
| Entry Point | 311.05 |
| Take Profit | 327.00 |
| Stop Loss | 304.00 |
| Key Levels | 285.00, 301.00, 311.00, 327.00 |
