

In yesterday’s address to the nation, the politician announced plans to intensify attacks on Iran within the next 2–3 weeks, which could trigger a new escalation of the conflict and lead to a significant increase in ammunition consumption, including missiles for Patriot and Tomahawk systems produced by the corporation. The prospect of replenishing the country's military arsenal suggests a potential increase in new orders for RTX Corp. Its order backlog is estimated at 268.0 billion dollars, 15.0% higher than last year, and further growth remains likely. Pratt & Whitney has already secured an additional 6.6 billion dollar contract to supply F135 engines for the F-35 Joint Strike Fighter program, including maintenance services for international customers.
Meanwhile, last month Raytheon completed the expansion of the Redstone Missile Integration Facility by 8,000 square meters, valued at 115.0 million dollars. The expansion is expected to increase production capacity by 50.0%, matching growing demand in the defense sector. Experts therefore anticipate a resumption of positive price dynamics despite the recent decline, supported by preliminary financial forecasts for this year: free cash flow is projected at 8.75 billion dollars, while earnings per share are expected in the range of 6.60–6.80 dollars.
Support and Resistance Levels
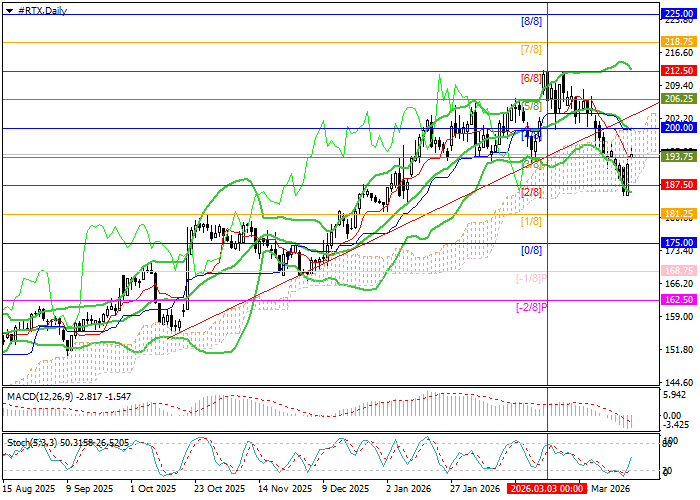
The instrument is attempting to consolidate above 193.75 (Murray level [3/8]), and after breaking the middle Bollinger Band at 200.00 (Murray level [4/8]), further growth is expected toward targets at 212.50 (Murray level [6/8], upper Bollinger Band) and 225.00 (Murray level [8/8]). However, if the price consolidates again below 187.50 (Murray level [2/8]), negative dynamics may resume toward 175.00 (Murray level [0/8]) and 168.75 (Murray level [–1/8]).
Technical indicators provide mixed signals: Bollinger Bands are turning downward, the MACD histogram remains stable in the negative zone, while Stochastic is turning upward from the oversold area, not excluding potential price growth.
Resistance levels: 200.00, 212.50, 225.00.
Support levels: 187.50, 175.00, 168.75.
Trading Scenarios and RTX Corp. Forecast
Long positions may be opened above 200.00 with targets at 212.50 and 225.00 and a stop-loss at 191.40. Implementation period: 5–7 days.
Short positions may be opened below 187.50 with targets at 175.00 and 168.75 and a stop-loss at 193.00.
Scenario
| Timeframe | Weekly |
| Recommendation | BUY STOP |
| Entry Point | 200.05 |
| Take Profit | 212.50, 225.00 |
| Stop Loss | 191.40 |
| Key Levels | 168.75, 175.00, 187.50, 200.00, 212.50, 225.00 |
Alternative Scenario
| Recommendation | SELL STOP |
| Entry Point | 187.45 |
| Take Profit | 175.00, 168.75 |
| Stop Loss | 193.00 |
| Key Levels | 168.75, 175.00, 187.50, 200.00, 212.50, 225.00 |
