

Middle East developments remain an important market driver. Iran said it was close to an agreement with Oman defining new shipping lanes through the Strait of Hormuz, but Tehran continues to demand several US concessions before a broader reopening of the waterway. Reuters reported that investors are therefore treating the prospect of easing pressure on global energy flows cautiously rather than as a completed de-escalation agreement.
The US second-quarter earnings season is also entering its later stages. Berkshire Hathaway published its results on Saturday, August 8. According to the company's official quarterly report, total revenue increased to $101.81 billion from $92.52 billion a year earlier. Net earnings attributable to Berkshire shareholders rose to $25.67 billion from $12.37 billion, while earnings per equivalent Class A share increased to $17,868 from $8,601.
Berkshire is now led by President and CEO Greg Abel, who took over the role on January 1, 2026, while Warren Buffett remains Chairman of the Board.
Warner Bros. Discovery reported a weaker revenue performance for the quarter ended June 30. The media and entertainment company reported approximately $8.7 billion in revenue, down from about $9.8 billion a year earlier, while earnings per share came in at $0.06. The company published its second-quarter results on August 6.
US Treasury yields remain another important factor for equities. After falling following Friday's weak employment report, yields rebounded during Monday's session as investors turned their attention to upcoming inflation data. The benchmark 10-year Treasury yield was trading around 4.66%–4.69% during the US morning session, compared with roughly 4.65% at the end of last week. The move suggests that some of Friday's bond-market reaction to weaker labour data has already been reversed.
Friday's session produced several large moves among S&P 500 stocks. Airbnb gained about 17.4% after stronger-than-expected quarterly results, while Microchip Technology advanced roughly 13.9% after issuing an upbeat revenue forecast. In contrast, Trade Desk fell 21.9%, making it the benchmark's worst performer of the session, while Akamai Technologies, Zoetis, ResMed and Seagate Technology also posted notable declines.
Support and Resistance Levels
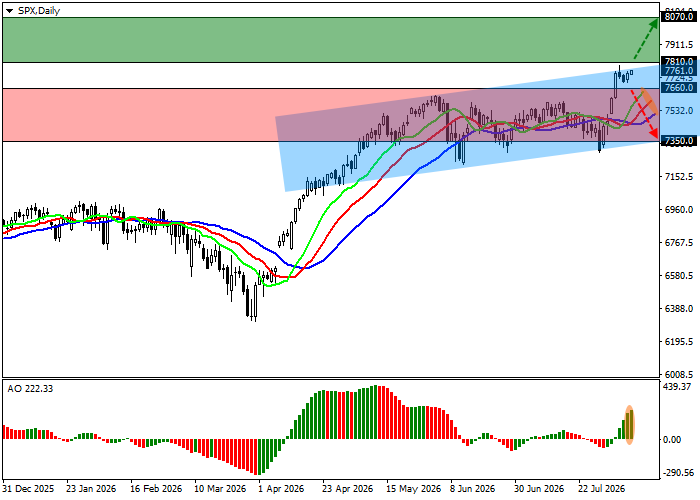
On the daily chart, the S&P 500 remains within an upward channel with approximate boundaries at 7,800.0 and 7,300.0. The index is currently attempting to move toward the upper boundary after its recent correction.
Technical indicators continue to provide a broadly positive signal. The faster moving averages of the Alligator indicator remain above the slower line, while the Awesome Oscillator histogram is forming corrective bars in positive territory.
Resistance levels: 7,810.0, 8,070.0.
Support levels: 7,660.0, 7,350.0.
S&P 500 Trading Scenarios and Forecast
Long positions may be considered after the index rises and consolidates above 7,810.0, with a target at 8,070.0 and a stop-loss at 7,720.0. Time horizon: seven days or more.
Short positions may be considered after a decline and consolidation below 7,660.0, with a target at 7,350.0 and a stop-loss at 7,800.0.
