

The corporation has already completed two quarters of fiscal year 2026, and the latest report, published at the end of April, showed positive results that largely helped interrupt the downward trend. Net revenue amounted to 11.2 billion dollars, up 17.0% due to annual revenue growth. Payment volume for the three-month period increased by 8.0% year-on-year, while cross-border payment volume excluding intra-Europe transactions rose by 11.0% in constant dollar terms. Service revenue increased by 13.0% to 5.0 billion dollars, revenue from international transactions grew by 10.0% to 3.6 billion dollars, other revenues advanced by 41.0%, and client incentives amounted to 4.2 billion dollars.
Revenue increased from 10.90 billion dollars to 11.20 billion dollars quarter-on-quarter, exceeding 9.59 billion dollars recorded in the same period a year earlier. Earnings per share rose from 3.17 dollars to 3.31 dollars, compared with 2.76 dollars last year. On June 1, the third indexed dividend payment of 0.67 dollars per share will be made, which corresponds to a yield of 0.83% versus the sector median of 1.42%.
Support and resistance levels
On the daily chart, the trading instrument is holding near the resistance line of the descending channel with boundaries at 335.00–295.00, preparing for a continuation of growth.
Technical indicators maintain a buy signal: the Alligator indicator’s fluctuation range remains in the positive zone, the fast EMAs are moving away from the signal line, and the AO histogram is forming corrective bars in positive territory.
Resistance levels: 335.00, 354.00.
Support levels: 323.00, 305.00.
Trading scenarios
Long positions may be opened after the price rises and consolidates above 335.00, with a target at 354.00. Stop-loss — 325.00. Expected timeframe: 7 days or more. Short positions may be opened after the price declines and consolidates below 323.00, with a target at 305.00 and a stop-loss at 330.00.
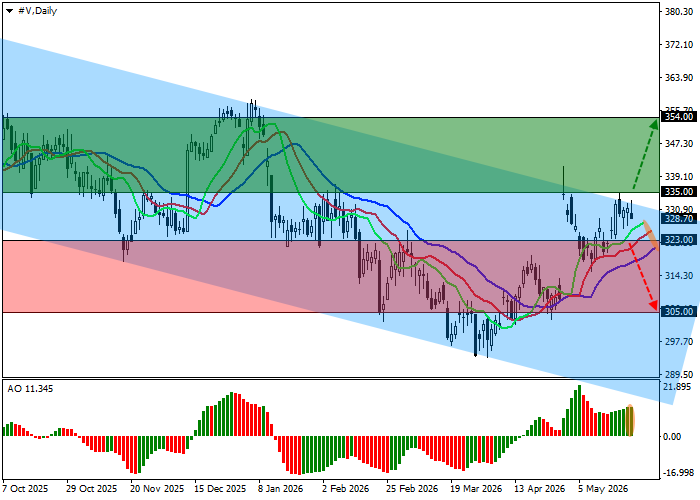
Visa Inc. price scenario and forecast
| Timeframe | Weekly |
| Recommendation | BUY STOP |
| Entry point | 335.05 |
| Take Profit | 354.00 |
| Stop Loss | 325.00 |
| Key levels | 305.00, 323.00, 335.00, 354.00 |
Alternative scenario
| Recommendation | SELL STOP |
| Entry point | 322.95 |
| Take Profit | 305.00 |
| Stop Loss | 330.00 |
| Key levels | 305.00, 323.00, 335.00, 354.00 |
