

At the end of last week, management announced that the partnership with Rivian Automotive Inc. in high-tech software development had entered a new phase. Following a research and engineering period exceeding €2.3 billion, winter testing of the first vehicles equipped with Rivian’s integrated platform was successfully completed at temperatures as low as –25°C. This system will become the core architecture for future Volkswagen AG, Scout Motors Inc., and Audi AG models, supporting compatibility with more than 15 sensor systems and 20 electronic control units in each vehicle.
The last major payment of $5.8 billion was made in November 2024, and total investment in the collaboration, including licensing and testing, has already exceeded $12.0 billion. The project is expected to enable production of up to 500,000 electric vehicles annually with integrated software, including Level 2+ autonomous driving capabilities and advanced drivetrain management. Analysts note that this creates a strategic advantage, reducing time-to-market for new models by 18–24 months and strengthening competition with Tesla Inc., BYD Co. Ltd., and other industry leaders.
The first-quarter financial report will be released on April 30 and may reflect revenue growth from €77.56 billion in the same period last year to €78.90 billion, while earnings per share are expected to increase from €3.67 to €4.43, compared to €6.28 in the previous reporting period. Last year’s dividend payment amounted to €6.30 per share, down from €9.00 in 2024. Considering the actual loss in the third quarter and improved forecasts for the first and second quarters, the corporation may increase dividends, with expected yields of 7.0–8.0%, significantly above the industry median of 4.64%.
Support and resistance levels
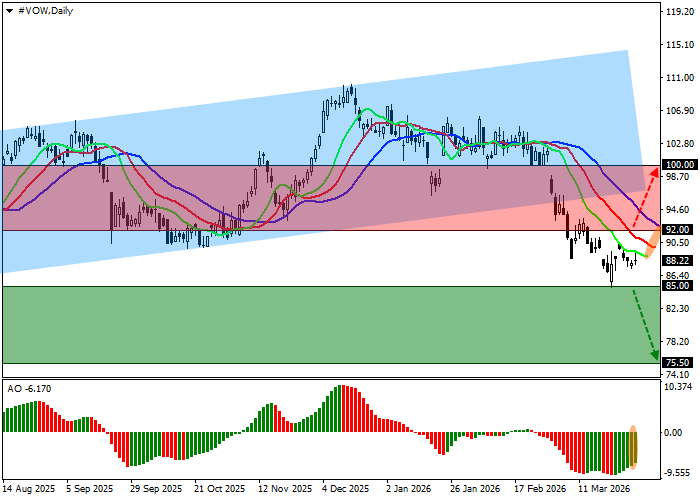
On the daily chart, the instrument is attempting to rebound from the support line of an ascending channel with dynamic boundaries at 115.00–96.00.
Technical indicators are slowing the sell signal: the fast EMAs of the Alligator indicator remain below the signal line but are approaching it, while the AO histogram is forming corrective bars in negative territory.
Resistance levels: 92.00, 100.00.
Support levels: 85.00, 75.50.
Trading scenarios and Volkswagen stock forecast
Short positions may be opened after a decline and consolidation below 85.00 with a target at 75.50. Stop-loss — 90.00. Implementation period: 7 days or more.
Long positions may be opened after growth and consolidation above 92.00 with a target at 100.00 and stop-loss at 89.00.
Scenario
| Timeframe | Weekly |
| Recommendation | SELL STOP |
| Entry Point | 84.95 |
| Take Profit | 75.50 |
| Stop Loss | 90.00 |
| Key Levels | 75.50, 85.00, 92.00, 100.00 |
Alternative Scenario
| Recommendation | BUY STOP |
| Entry Point | 92.05 |
| Take Profit | 100.00 |
| Stop Loss | 89.00 |
| Key Levels | 75.50, 85.00, 92.00, 100.00 |
