
Top Pick
- Fully licensed and regulated US exchange
- Strong focus on security and compliance
- User-friendly interface for beginners

The cryptocurrency market strengthened earlier this week but came under sharp selling pressure on Thursday, erasing much of its previous gains. In the latest market snapshot, Bitcoin (BTC) is trading near 81600.00 (+0.9%), Ethereum (ETH) at 2400.00 (+2.1%), Tether (USDT) at 0.9991 (–0.01%), BNB at 744.00 (+5.1%) and XRP at 1.3250 (+4.8%). Total cryptocurrency market capitalization has declined to approximately $2.73 trillion, while Bitcoin dominance has increased to 60.0%. From October 19 to 22, US spot Bitcoin ETFs recorded net inflows of $439.1 million, while Ethereum ETFs saw outflows of $225.1 million. The market remains volatile despite the recovery attempt discussed in our previous crypto weekly review.

 By John Isige
 Nearly a 60% drop over the past year has left Cardano investors frustrated. Project founder Charles Hoskinson is now urging the community to become more active. The 2026 crypto bear market has spared no one: Bitcoin has fallen about 20% year-over-year, XRP corrected by 43%, but Cardano has been hit particularly hard — with a painful 64% decline.
 By John Isige
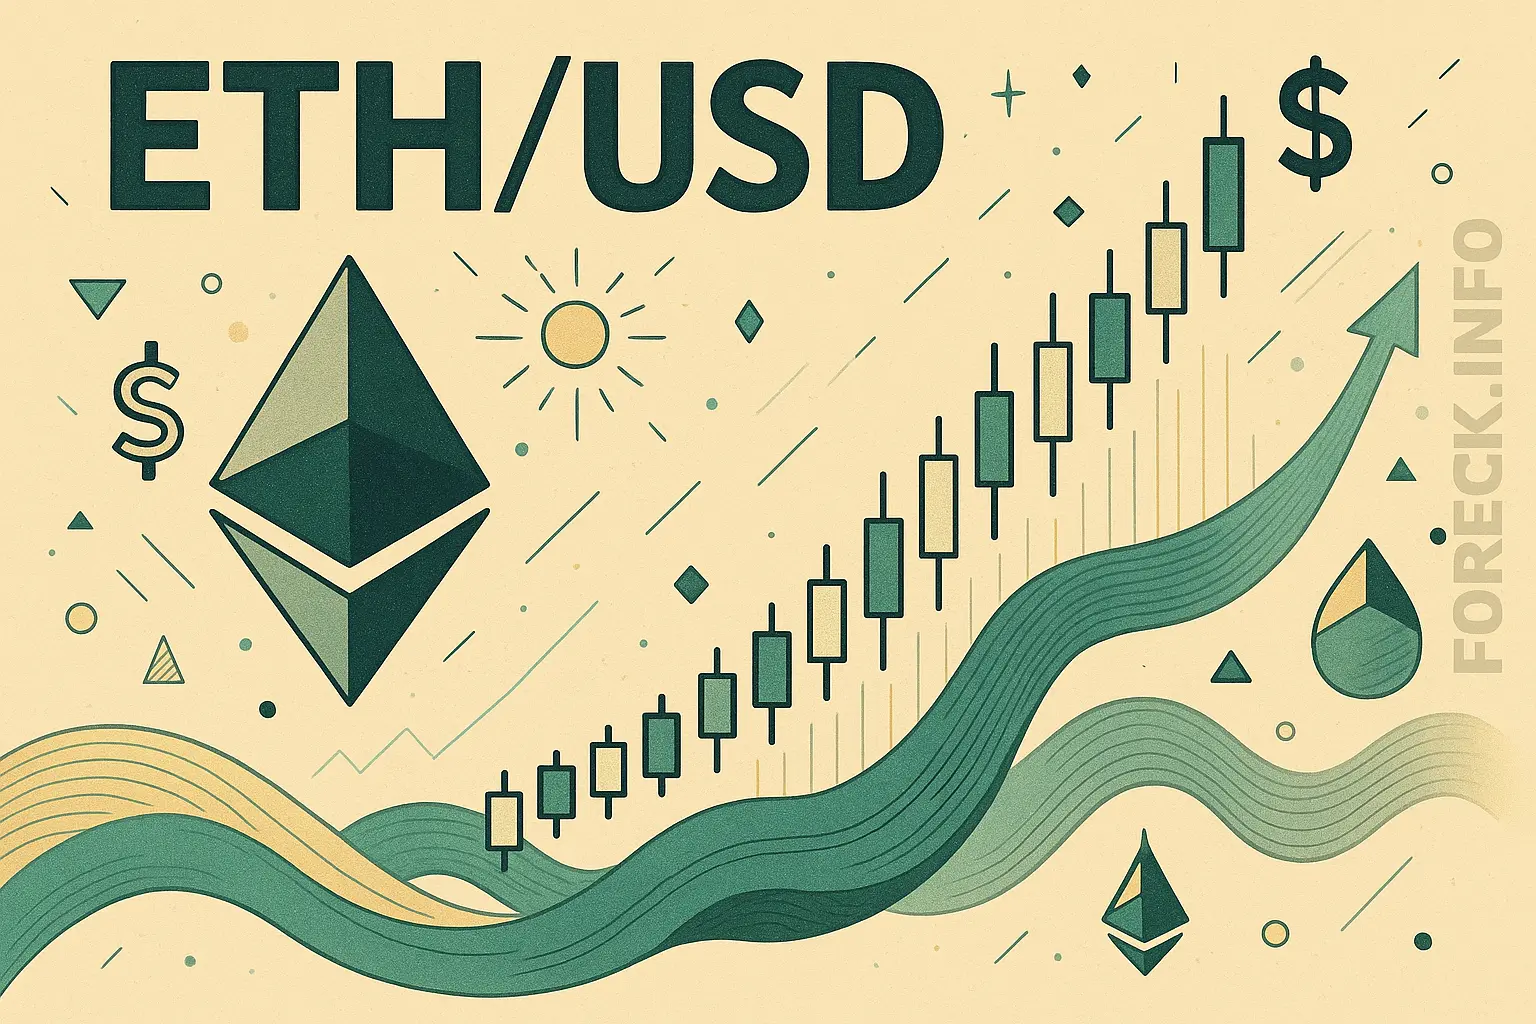
 The ETH/USD pair has returned to the main sideways range of 2187.50–1875.00 (Murray [3/8]–[2/8]), which it briefly left last week, and has stabilized near its upper boundary. From here, downward momentum may resume toward 1875.00 (Murray [2/8], lower Bollinger Band), 1481.60 (100.0% Fibonacci retracement), and 1250.00 (Murray [0/8]). The key level for bulls remains 2500.00 (Murray [4/8], middle Bollinger Band, W1). A breakout above this mark would allow the instrument to exit the descending channel and continue rising toward 2812.50 (Murray [5/8], 61.8% Fibonacci retracement) and 3125.00 (Murray [6/8], 50.0% Fibonacci retracement), opening the way for a possible reversal of the long-term trend.
 By John Isige
 A potential Iran deal is triggering noticeable moves across global markets. Bitcoin remains above the 70,000$ level, but uncertainty remains high. The key question now is whether the crypto market is approaching its next directional move.
 By John Isige
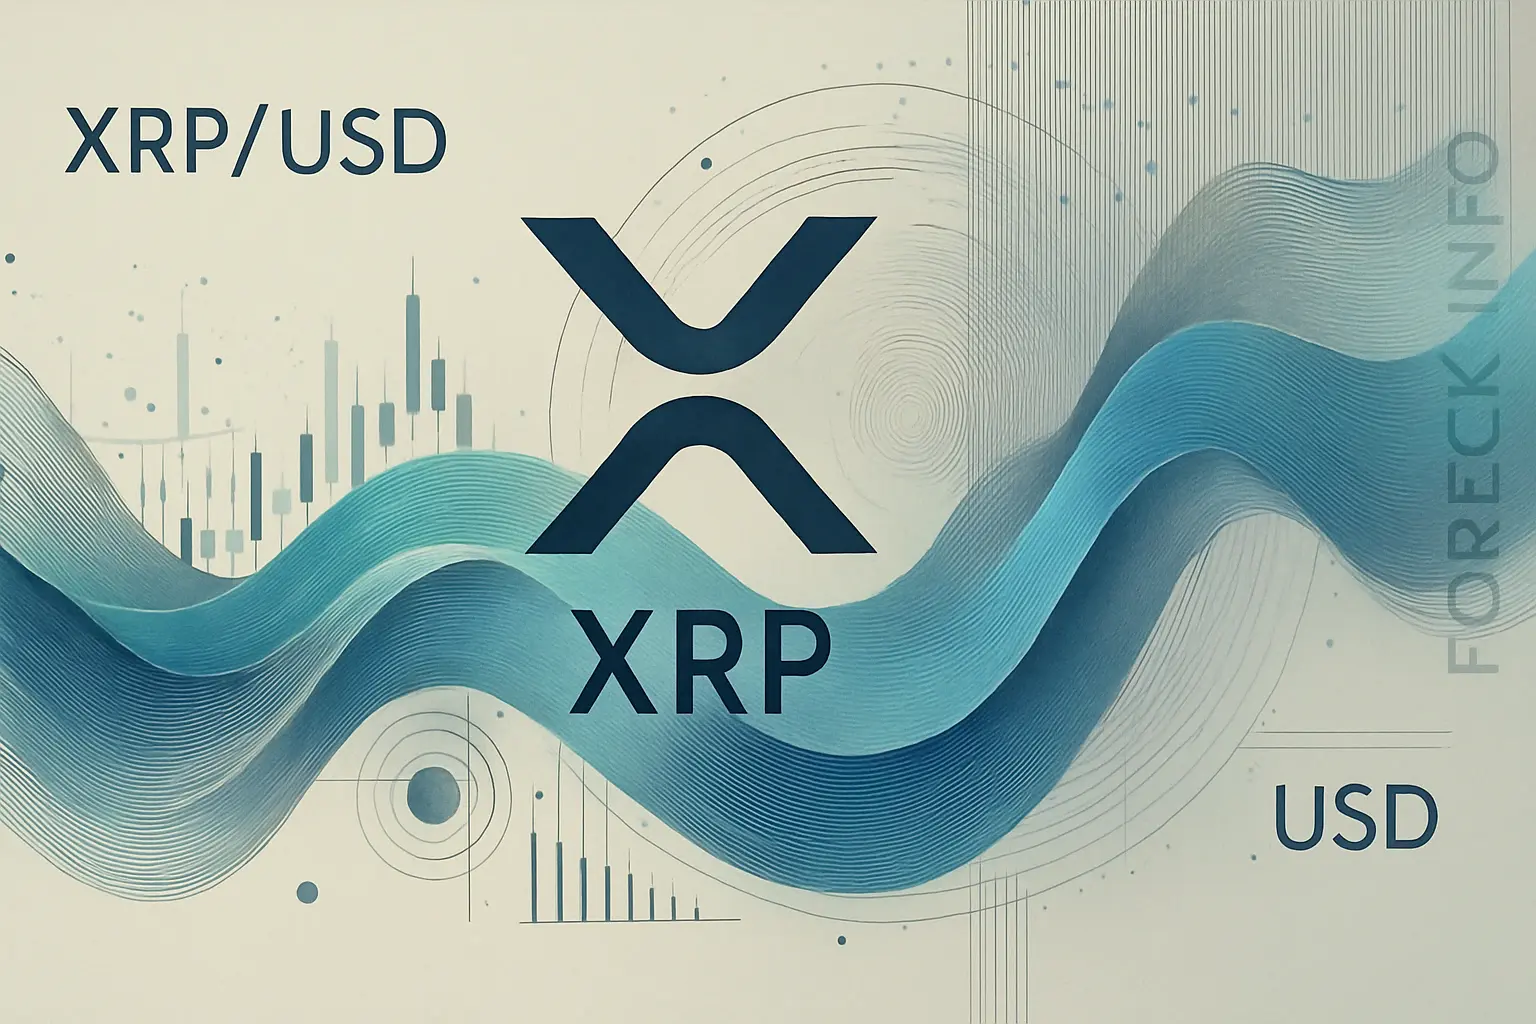
 The XRP/USD pair continues to hold within the sideways channel of 1.5625–1.3671 (Murray [4/8]–[3/8]). Last week, the price reached the lower boundary of this range, but then partially recovered lost ground and is now trading near the middle Bollinger Band line at 1.4235 amid conflicting reports about the development of the US-Iran conflict, which are preventing the instrument from determining a clear direction.
 By John Isige
 While Bitcoin remains stuck in a sideways range, the Ethena stablecoin protocol continues to face selling pressure. Despite a number of positive fundamental developments, the ENA token has lost around 17% over the past seven days, raising the question once again: is a buying opportunity forming, or does the market need more time to stabilize?
 By John Isige
 Last week, the BTC/USD pair tested the 75000.00 mark (Murray [4/8] level), but then resumed its decline and returned to the 68500.00 area. This month, the price has already made several attempts to recover, but has so far failed to establish an upward trend, as geopolitical and monetary factors continue to pressure assets that compete with the US dollar.
 By John Isige
 Rising energy costs, geopolitical risks, and falling revenues are increasing pressure on Bitcoin miners. The first signs of stress are already starting to appear across the network.
 By John Isige
 An attacker exploited the Resolv platform, draining approximately $25 million and simultaneously breaking the peg of its native stablecoin USR.
 By John Isige
 Crypto companies are cutting staff again, as Algorand, Gemini, and Crypto.com respond to the recent market sell-off and the sector’s ongoing weakness.
 By John Isige
 Gold prices are falling sharply and posting their biggest weekly drop in decades. The question now is whether this is only a correction or the start of a broader trend reversal.
 By John Isige
 Gold Token S.A. is launching its gold-backed stablecoin DGLD on the Base network and has ambitious plans for the project’s expansion.
 By Andrew Bennett
 Geopolitical tensions and renewed interest rate concerns are putting pressure on the crypto market. Bitcoin and other digital assets are declining at the start of the weekend.


For crypto, the framework is similar to traditional financial markets but comes with its own twist. Here, price action turns on liquidity, adoption, regulation, and flows from institutions alongside retail sentiment. Network health—hash rate, staking, active wallets—adds another layer. Macro still matters too: rates, dollar strength, and risk appetite shape inflows and outflows. Then, as with any market, you use the chart—trend, support and resistance, momentum, and volume—to spot setups and manage risk.