

According to most analysts, signs of a cooling labor market and moderate inflation growth (3.0% in September vs. 3.1% expected) make a –25 basis point rate cut at Wednesday’s 20:00 (GMT+2) meeting almost certain. The Fed is also likely to continue its monetary easing cycle in December. Meanwhile, talks between the U.S. and China are expected to be constructive — both sides have already sent encouraging signals ahead of the meeting. Chinese official Li Chengang said that preliminary consensus was reached on several key issues, including export control, fentanyl, and transportation fees. U.S. Treasury Secretary Scott Bessent told CBS that the 100% tariffs on Chinese imports are effectively off the table.
President Trump also stated that both sides are close to finalizing a trade agreement. These developments reduce the risk of renewed trade tensions and decrease the likelihood of a global economic slowdown.
Against this backdrop, the U.S. dollar continues to weaken, while demand for risk assets — including Bitcoin — is growing. The Fear & Greed Index also moved into the neutral zone for the first time in several weeks, currently standing at 51.
Support and Resistance Levels
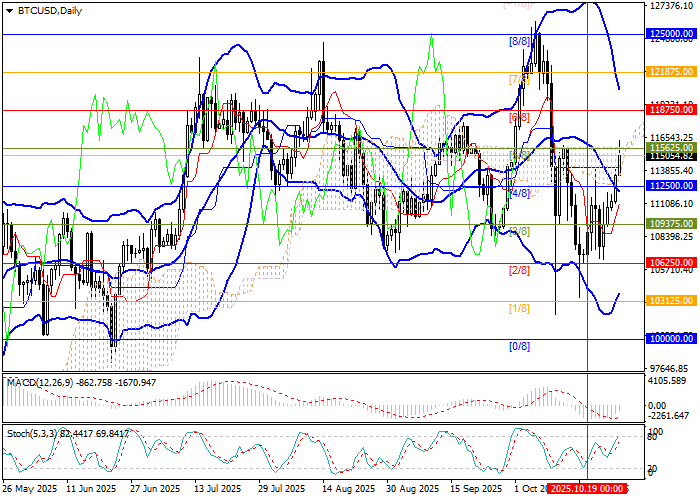
The instrument has broken above the middle line of the Bollinger Bands and is now testing 115,625.00 (Murray level [5/8]). A firm close above this level could open the way toward 121,875.00 (Murray level [7/8]) and 125,000.00 (Murray level [8/8]). On the downside, the key support remains at 112,500.00 (Murray level [4/8]), reinforced by the Bollinger midline. A renewed breakout below it could trigger a decline toward 106,250.00 (Murray level [2/8]) and 100,000.00 (Murray level [0/8]).
Technical indicators show mixed signals: Bollinger Bands are turning downward, MACD is preparing to enter positive territory, and the Stochastic oscillator is trending upward but approaching the overbought zone — a possible sign of a short-term correction.
Resistance levels: 115,625.00, 121,875.00, 125,000.00.
Support levels: 112,500.00, 106,250.00, 100,000.00.
Bitcoin Trading Scenarios and Outlook
Long positions can be opened above 115,625.00 with targets at 121,875.00 and 125,000.00, and a stop-loss at 113,200.00. Estimated time frame: 5–7 days.
Short positions can be considered below 112,500.00 with targets at 106,250.00 and 100,000.00, and a stop-loss at 115,000.00.
Scenario
| Time Frame | Weekly |
| Recommendation | BUY STOP |
| Entry Point | 115,625.05 |
| Take Profit | 121,875.00, 125,000.00 |
| Stop Loss | 113,200.00 |
| Key Levels | 100,000.00, 106,250.00, 112,500.00, 115,625.00, 121,875.00, 125,000.00 |
Alternative Scenario
| Recommendation | SELL STOP |
| Entry Point | 112,499.95 |
| Take Profit | 106,250.00, 100,000.00 |
| Stop Loss | 115,000.00 |
| Key Levels | 100,000.00, 106,250.00, 112,500.00, 115,625.00, 121,875.00, 125,000.00 |