

In response, Iran launched Operation “True Promise 4”, targeting more than 20 US military bases in Bahrain, Qatar, Kuwait, and the United Arab Emirates, as well as sites in Israel and Cyprus, with ballistic missiles and drones. Today marks the fourth day of the military conflict, whose geography is rapidly expanding across the Middle East. The most critical issue now is the disruption of traffic through the Strait of Hormuz, where between 18.0 and 21.0 million barrels of oil and petroleum products are transported daily, representing roughly 20.0–25.0% of global seaborne exports and up to 20.0% of global consumption. The navigational channel effectively consists of two corridors about 3.0 km wide each, meaning even isolated incidents immediately affect all shipping traffic. Following attacks on the tankers Skylight (Palau flag) and Stena Imperative (US flag), as well as reports of a fire aboard MKD VYOUM in Omani territorial waters, shipping volumes have reportedly fallen by about 15.0–25.0%, insurance premiums have increased 2.0–4.0 times, and large tanker freight rates are up 30.0–50.0%. Meanwhile, oil prices are already reflecting a geopolitical risk premium of $3.0–8.0 per barrel. Iraq remains the most vulnerable, as around 94.0% of its energy exports—approximately 3.4 million barrels per day—pass through this route. In the event of a full shutdown, exports could fall to just 0.4 million barrels per day via alternative routes, and since oil revenues account for over 90.0% of the country’s budget, such a decline would inevitably create a fiscal shortfall and pressure the national currency.
Naturally, amid the sharp escalation in the Middle East, inventory data published by the American Petroleum Institute (API) and the Energy Information Administration (EIA) will not be the key driver of price action, so the focus should instead remain on the broader fundamental backdrop and demand indicators. Demand is recovering actively, and it is clear that trading volumes this week may once again approach annual highs. As of February 27, the Chicago Mercantile Exchange (CME) recorded 1.3 million futures contract positions traded, significantly above the 680.0 thousand registered on February 23. Options activity also increased sharply, with 344.0 thousand contracts traded on Friday compared with 170.0 thousand previously.
Support and resistance levels
On the daily chart, the instrument is trading well above the resistance line of the descending channel with dynamic boundaries at 63.00–56.00, moving within a new upward wave.
Technical indicators continue to hold a buy signal: the fast EMAs of the Alligator indicator remain above the signal line and are actively widening away from it, while the AO histogram is forming new corrective bars in the buy zone.
Support levels: 75.50, 70.30.
Resistance levels: 81.50, 87.70.
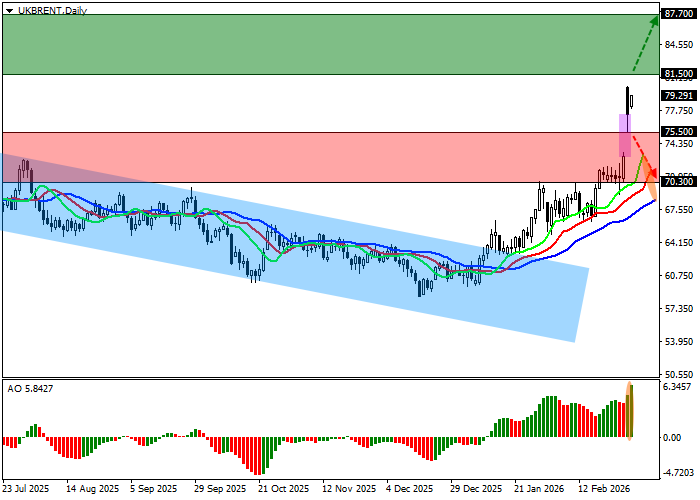
Trading scenarios and Brent Crude Oil price forecast
Long positions may be opened after the price consolidates above 81.50, with a target at 87.70. Stop-loss: 79.00. Implementation period: 7 days or more.
Short positions may be opened after the price consolidates below 75.50, with a target at 70.30. Stop-loss: 77.00.
Scenario
| Timeframe | Weekly |
| Recommendation | BUY STOP |
| Entry Point | 81.55 |
| Take Profit | 87.70 |
| Stop Loss | 79.00 |
| Key Levels | 70.30, 75.50, 81.50, 87.70 |
Alternative scenario
| Recommendation | SELL STOP |
| Entry Point | 75.45 |
| Take Profit | 70.30 |
| Stop Loss | 77.00 |
| Key Levels | 70.30, 75.50, 81.50, 87.70 |
