

Investors are assessing yesterday’s US manufacturing activity data released by the Institute for Supply Management (ISM): in February, the index came in at 52.4 points, remaining in expansion territory for the first time since April. The price component was particularly important, as producer prices climbed to their highest level since June 2022 at 70.5 points, driven by higher steel and aluminum costs, as well as tariffs on imported materials affecting the entire production chain. On the London Metal Exchange (LME), the benchmark aluminum price moved above $3.0K per ton, reaching its highest level since April 2022. In recent weeks, the trading range has fluctuated between roughly $3.03K per ton and $3.12K–$3.30K per ton, depending on the contract, which is about 20.0% above last year’s average, while prices gained more than 10.0% in January alone.
Markets reacted quickly to the inflation risks: the yield on 10-year Treasury bonds rose by more than 8.0 basis points, moving above the psychologically important 4.04% level, while 2-year notes, which are the most sensitive to monetary policy expectations, climbed by 10.8 basis points. At the same time, the US dollar reached its highest level since January 22 at 98.55 on the USDX, gaining support as a safe-haven asset. It is also worth noting that, according to the CME FedWatch Tool, the probability that the Federal Reserve will leave interest rates unchanged through June has been revised up from 42.7% to 53.5%.
The index is also being significantly influenced by the escalation of the US-Iran conflict in the Middle East. The effective blockade of the Strait of Hormuz, through which around 20.0% of global oil supplies pass, has pushed WTI Crude Oil prices up to $72.0 per barrel and Brent Crude Oil to $78.0 per barrel, providing notable support for major energy companies within the DJIA. Shares of Exxon Mobil Corp., for example, have risen by about 3.5% over the past week and by 26.7% over the past year, while Chevron Corp. has gained 1.5% and 22.5%, respectively. The defense sector has also reacted positively: shares of Lockheed Martin Corp. climbed by 7.0–8.0%, Northrop Grumman Corp. by 5.0–6.0%, and RTX Corp. by 4.0–6.0%, substantially outperforming the broader market. Interest in the sector is growing amid a record US defense budget of more than $880.0B per year and expectations of additional appropriations if the confrontation escalates, alongside rising orders for air defense systems, missile weapons, and maintenance services. As a result, defense companies are increasingly being viewed by the market as a defensive asset during periods of geopolitical instability.
Support and resistance levels
On the daily chart, the Bollinger Bands are moderating lower: the price range is expanding to the downside, although it is struggling to keep pace with market activity. The MACD is moving downward, maintaining a firm sell signal, with the histogram remaining below the signal line, while Stochastic is approaching the 20 mark, pointing to growing risks of the index becoming oversold in the ultra-short term.
Resistance levels: 48599.5, 48873.9, 49200.0, 49500.0.
Support levels: 48316.9, 48104.5, 47719.8, 47450.6.
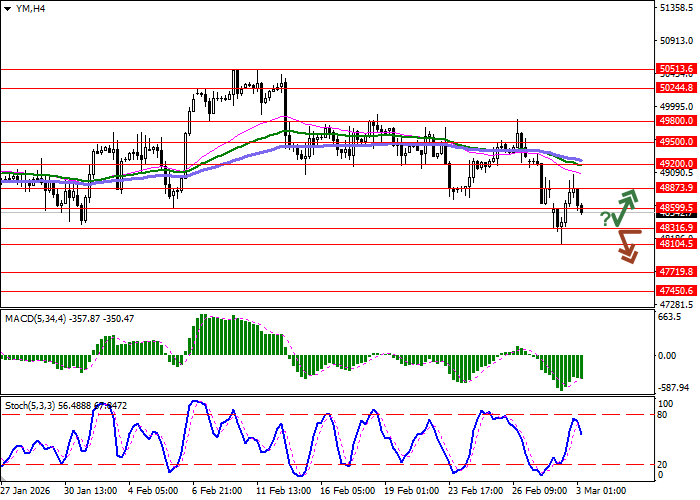
Trading scenarios and DJIA forecast
Short positions may be opened after a breakout below the 48316.9 level, with a target at 47719.8. Stop-loss: 48599.5. Timeframe: 1–2 days.
Long positions may be opened after a rebound from the 48316.9 level and a breakout above 48599.5, with a target at 49200.0. Stop-loss: 48316.9.
Scenario
| Timeframe | Intraday |
| Recommendation | SELL STOP |
| Entry Point | 48316.5 |
| Take Profit | 47719.8 |
| Stop Loss | 48599.5 |
| Key Levels | 47450.6, 47719.8, 48104.5, 48316.9, 48599.5, 48873.9, 49200.0, 49500.0 |
Alternative scenario
| Recommendation | BUY STOP |
| Entry Point | 48600.0 |
| Take Profit | 49200.0 |
| Stop Loss | 48316.9 |
| Key Levels | 47450.6, 47719.8, 48104.5, 48316.9, 48599.5, 48873.9, 49200.0, 49500.0 |
