

In August, the US Consumer Price Index rose 3.4% year-on-year, while core CPI, excluding food and energy, increased 2.4%, according to the US Bureau of Labor Statistics. Headline inflation therefore remains elevated, while the Federal Reserve's formal 2.0% inflation objective applies to the Personal Consumption Expenditures (PCE) price index.
Energy prices remain an important source of inflationary pressure. Disruptions to shipping through the Strait of Hormuz and continued instability across the Middle East have pushed oil prices back above $100 per barrel. On Monday, US President Donald Trump rejected an Iranian proposal aimed at reopening the Strait of Hormuz and reducing regional hostilities, according to Reuters, although diplomatic contacts through mediators have continued.
The latest developments have strengthened expectations that the Federal Reserve may continue tightening monetary policy after raising the federal funds target range by 25 basis points to 3.75–4.00% earlier this month.
Several Federal Open Market Committee (FOMC) officials have recently maintained a hawkish tone. Cleveland Fed President Beth Hammack warned that persistently elevated inflation could create an "inflationary mindset" among households and businesses and said monetary policy needs to remain restrictive enough to return inflation toward target.
Federal Reserve Governor Lisa Cook also highlighted renewed price pressures in a September 28 speech. She noted that higher energy costs, supply-chain disruptions and strong investment in artificial intelligence infrastructure are contributing to inflationary risks. Cook added that the resilient labour market gives policymakers room to focus on restoring price stability.
Market attention is now shifting to the September US labour market report, scheduled for Friday, October 2 at 08:30 ET. A continuation of strong employment growth and a stable unemployment rate could strengthen expectations for another increase in borrowing costs at the Federal Reserve's next meeting. Futures markets currently assign roughly a 70% probability to an additional 25-basis-point increase in October.
Meanwhile, the European Central Bank is taking a more measured approach to monetary tightening. ECB President Christine Lagarde said on Monday that the recent inflation surge has not yet generated dangerous second-round effects across the euro area and that a moderate policy response remains appropriate.
This does not mean the ECB has abandoned further rate increases. Instead, policymakers appear to favour a gradual tightening path, while the Federal Reserve is facing stronger pressure from persistent inflation and a resilient US economy. A widening difference in the expected pace of monetary tightening could continue to support the US dollar against the euro in the medium term.
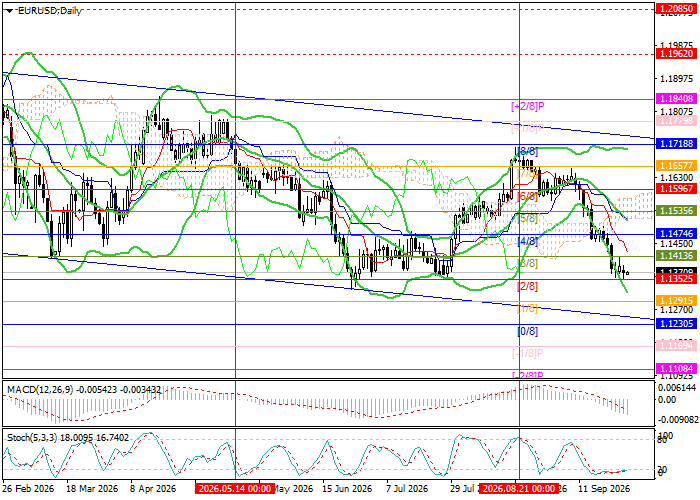
As discussed in our previous EUR/USD outlook, expectations surrounding Fed and ECB policy have remained one of the main drivers of the currency pair. Since then, the euro has reversed sharply from the 1.1600–1.1700 area and returned toward the important 1.1352 support zone.
Support and resistance levels
The trading instrument is approaching 1.1352 (Murray level [2/8]). A confirmed breakout below this level may open the way toward 1.1230 (Murray level [0/8]), 1.1108 (Murray level [–2/8]) and 1.0986 (Murray level [–2/8], W1).
However, if the pair consolidates above the middle Bollinger Band around 1.1535 (Murray level [5/8]), an upward correction could resume toward 1.1718 (Murray level [8/8], upper Bollinger Band) and 1.1840 (Murray level [+2/8]).
Technical indicators continue to generate a sell signal: the Bollinger Bands are turning downward and the MACD histogram is expanding in negative territory. At the same time, the Stochastic oscillator may soon leave the oversold zone, which leaves room for a limited upward correction.
Resistance levels: 1.1535, 1.1718, 1.1840.
Support levels: 1.1352, 1.1230, 1.1108, 1.0986.
EUR/USD trading scenarios and exchange rate forecast
Short positions may be opened below 1.1352 with targets at 1.1230, 1.1108 and 1.0986 and a stop-loss at 1.1440. Estimated implementation period: 5–7 days.
Long positions may be opened above 1.1535 with targets at 1.1718 and 1.1840 and a stop-loss at 1.1430.
Scenario
| Timeframe | Weekly |
| Recommendation | SELL |
| Entry point | 1.1349 |
| Take Profit | 1.1230, 1.1108, 1.0986 |
| Stop Loss | 1.1440 |
| Key levels | 1.0986, 1.1108, 1.1230, 1.1352, 1.1535, 1.1718, 1.1840 |
Alternative scenario
| Recommendation | BUY STOP |
| Entry point | 1.1535 |
| Take Profit | 1.1718, 1.1840 |
| Stop Loss | 1.1430 |
| Key levels | 1.0986, 1.1108, 1.1230, 1.1352, 1.1535, 1.1718, 1.1840 |
