
Speaking at the Jackson Hole symposium last Friday, Fed Chair Kevin Warsh delivered a clearly hawkish signal. He said price pressures remain significant, broad financial conditions are not restrictive, and the labor market is consistent with full employment. Warsh added that the Fed must be confident inflation is moving clearly and quickly enough toward its 2.0% target; otherwise, policymakers still have work to do. The subsequent escalation of the U.S.-Iran conflict strengthened expectations of a rate hike in September and possibly another increase before year-end. Renewed missile strikes have raised the risk of an energy shock, pushing oil prices and government bond yields higher. The yield on 10-year U.S. Treasury notes approached a nearly three-year high of 4.81% today.
On Friday at 14:30 (GMT+2), traders will focus on the U.S. employment report. Current estimates suggest that unemployment remained at 4.1% in August, while nonfarm payrolls increased by around 56,000, indicating stabilization after July’s decline. A stronger-than-expected report would reinforce expectations of two rate increases this year, although it would not make them certain. CME FedWatch currently puts the probability of a September rate hike at around 70%, while the probability of at least one increase by December is about 91%. Comments from policymakers also support the Fed’s hawkish stance: Federal Open Market Committee member Michael Barr said officials should act decisively to raise rates if inflation does not moderate sufficiently.
Similar conditions have recently emerged in the euro area, although they have so far failed to support the euro. According to Eurostat, annual inflation accelerated from 2.9% to 3.3% in August, while the core rate eased from 2.5% to 2.4%, remaining above the ECB’s 2.0% target. These figures keep ECB tightening at the September meeting in play.
Support and Resistance Levels
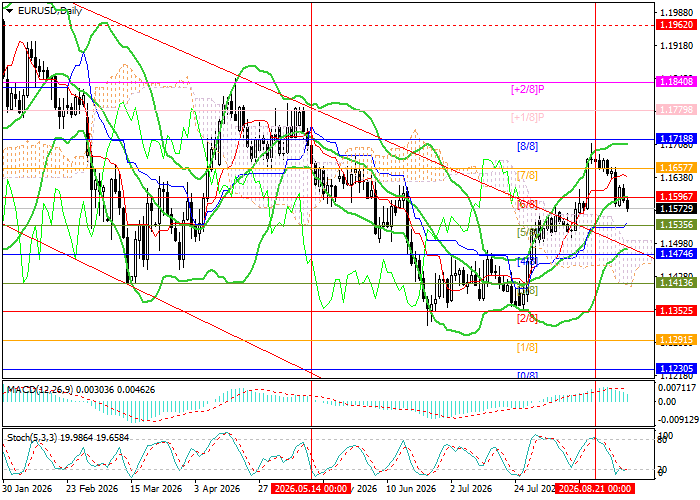
The pair has moved below the middle Bollinger Band at 1.1596 (Murrey [6/8]), opening the way toward 1.1474 (Murrey [4/8], lower Bollinger Band) and 1.1352 (Murrey [2/8]). However, a renewed break above 1.1657 (Murrey [7/8]) could support a recovery toward 1.1779 (Murrey [+1/8]) and 1.1840 (Murrey [+2/8]).
Technical indicators remain mixed: the Bollinger Bands are pointing upward, the MACD histogram is preparing to move below zero, while Stochastic has reached oversold territory and may reverse higher.
Support levels: 1.1474, 1.1352.
Resistance levels: 1.1657, 1.1779, 1.1840.
EUR/USD Trading Scenarios and Price Forecast
Short positions may be opened below 1.1565, with targets at 1.1474 and 1.1352 and a stop-loss at 1.1630. Time frame: 5–7 days. Long positions may be opened above 1.1657, with targets at 1.1779 and 1.1840 and a stop-loss at 1.1580.
Scenario
| Timeframe | Weekly |
| Recommendation | SELL STOP |
| Entry Point | 1.1565 |
| Take Profit | 1.1474, 1.1352 |
| Stop Loss | 1.1630 |
| Key Levels | 1.1352, 1.1474, 1.1657, 1.1779, 1.1840 |
Alternative Scenario
| Recommendation | BUY STOP |
| Entry Point | 1.1657 |
| Take Profit | 1.1779, 1.1840 |
| Stop Loss | 1.1580 |
| Key Levels | 1.1352, 1.1474, 1.1657, 1.1779, 1.1840 |
