

In recent days, attacks by Yemen's Houthi forces against Saudi Arabia's energy infrastructure have intensified. In particular, reports have emerged of strikes targeting gas processing facilities, while an attack on the headquarters of state-owned Saudi Aramco in Dhahran caused a fire and damage to an administrative building. Meanwhile, attacks on commercial vessels in the Strait of Hormuz are becoming more frequent. According to the United Kingdom Maritime Trade Operations (UKMTO), a container ship and an oil tanker were struck by unidentified projectiles on Tuesday, while the total number of vessels attacked since the end of last month has exceeded two dozen, according to media reports. Some market analysts suggest that if the current escalation continues and supply disruptions intensify, crude oil prices could rise further toward 120.00–125.00 in the medium term. Additional support comes from strong economic data from China. In September, exports surged by 36.3% year-on-year, significantly exceeding forecasts of 25.5%, supported by growing demand for components used in data centres and artificial intelligence (AI) infrastructure. Imports increased by 31.0%, bringing the country's trade surplus to $133.53 billion. These figures point to strong external trade activity, although the outlook for domestic demand remains uncertain. Nevertheless, sustained economic growth in China could support additional oil consumption in the world's largest crude importer.
On the other hand, positive price dynamics are being restrained by the latest OPEC report, according to which the cartel and its allies increased crude oil production by approximately 900.0K barrels per day in September, bringing total output to 39.07 million barrels per day. Saudi Arabia remained the leading producer within the group, despite the ongoing Houthi attacks, with output reaching 8.372 million barrels per day as the kingdom continued restoring production and export capacity.
Today, October 14, at approximately 22:30 (GMT+2), the American Petroleum Institute (API) is scheduled to release its weekly crude oil inventory report. The previous reading showed a decline of 2.090 million barrels, and a continuation of this trend could provide additional support for the market. Tomorrow, October 15, at 18:00 (GMT+2), analysts will receive the latest crude oil inventory data from the US Energy Information Administration (EIA), which reported a decline of approximately 3.186 million barrels in the previous reporting period.
As discussed in our previous Brent Crude Oil forecast, persistent geopolitical tensions and disruptions to energy transportation in the Persian Gulf continue to support oil prices despite the recovery in production among OPEC+ members.
Support and resistance levels
The trading instrument continues to move within a medium-term upward trend, forming an ascending channel, and is testing the upper Bollinger Band near 106.25 (Murray level [+1/8]). Sustained consolidation above this level could open the way toward 112.50 (Murray level [+2/8], 0.0% Fibonacci retracement) and 114.30 (annual high). However, if the price breaks below the middle Bollinger Band at 100.00 (Murray level [8/8], 23.6% Fibonacci retracement), a deeper correction toward 91.70 (38.2% Fibonacci retracement) and 85.40 (50.0% Fibonacci retracement) may follow.
Technical indicators are giving mixed signals: Bollinger Bands are turning horizontal, the MACD histogram remains stable in positive territory, while Stochastic has reached the overbought zone, which does not rule out a limited downward correction.
Resistance levels: 106.25, 112.50, 114.30.
Support levels: 100.00, 91.70, 85.40.
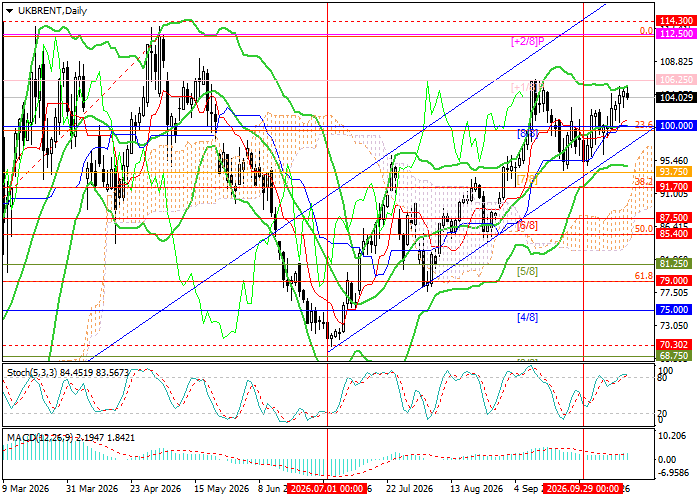
Brent Crude Oil trading scenarios and price forecast
Long positions may be opened above 106.25, with targets at 112.50 and 114.30 and a stop-loss at 102.20. Estimated implementation period: 5–7 days.
Short positions may be opened below 100.00, with targets at 91.70 and 85.40 and a stop-loss at 103.80.
Scenario
| Timeframe | Weekly |
| Recommendation | BUY STOP |
| Entry point | 106.25 |
| Take Profit | 112.50, 114.30 |
| Stop Loss | 102.20 |
| Key levels | 85.40, 91.70, 100.00, 106.25, 112.50, 114.30 |
Alternative scenario
| Recommendation | SELL STOP |
| Entry point | 100.00 |
| Take Profit | 91.70, 85.40 |
| Stop Loss | 103.80 |
| Key levels | 85.40, 91.70, 100.00, 106.25, 112.50, 114.30 |
