

On the daily chart, the price remains above the support line of the ascending channel with dynamic boundaries of 305.00–218.00.
On the four-hour chart, the stock has not yet tested the support line near 218.00, although the probability of such a move remains elevated. A breakdown below the early-October low of 227.00 could open the way toward the 200.00 area. The key obstacle to a recovery remains the resistance level at 248.00.
Technical indicators maintain a sell signal: the fluctuation range of the Alligator indicator's EMAs is widening to the downside, while the AO histogram is forming corrective bars in negative territory.
Adobe's recent weakness was also reflected in our previous US stock market review, which highlighted the company among the session's largest decliners.
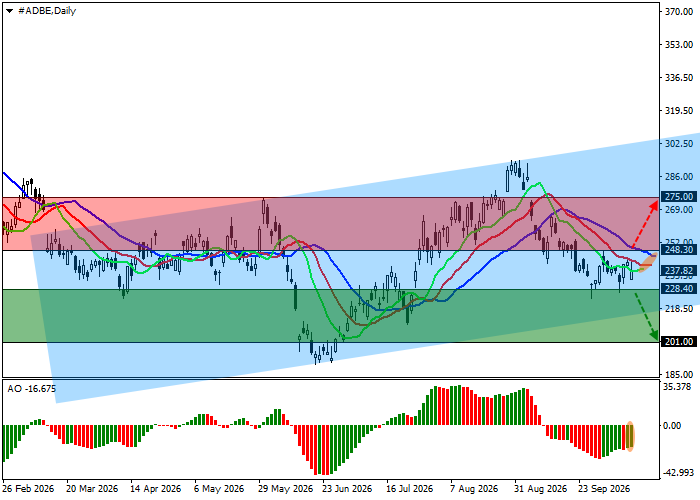
Adobe stock trading scenarios and ADBE price forecast
Short positions may be opened after the price declines and consolidates below 228.40, with a target at 201.00. Stop-loss — 235.00. Estimated implementation period: 7 days or more.
Long positions may be opened after the price rises and consolidates above 248.30, with a target at 275.00. Stop-loss — 235.00.
Scenario
| Timeframe | Weekly |
| Recommendation | SELL STOP |
| Entry point | 228.40 |
| Take Profit | 201.00 |
| Stop Loss | 235.00 |
| Key levels | 201.00, 228.40, 248.30, 275.00 |
Alternative scenario
| Recommendation | BUY STOP |
| Entry point | 248.30 |
| Take Profit | 275.00 |
| Stop Loss | 235.00 |
| Key levels | 201.00, 228.40, 248.30, 275.00 |
