

Over the past year and into 2026, the region has seen increased investment in infrastructure for storing and trading physical gold. HSBC Holdings Plc has said it plans to expand its gold storage capacity in Hong Kong to 200 tonnes. Separately, the Hong Kong government has set a target of expanding the city's total gold storage capacity to more than 2,000 tonnes within three years, while the Airport Authority Hong Kong is working toward a thousand-tonne-scale storage facility. The development reflects Hong Kong's broader effort to strengthen its role as a regional gold trading, clearing and storage hub. Authorities are also establishing a government-owned central clearing system and deepening cooperation with the Shanghai Gold Exchange.
Demand for gold investment products in Asia has also remained strong. According to the World Gold Council, Asian-listed physically backed gold ETFs attracted $12 billion during the first half of 2026, their strongest H1 on record. Their holdings increased by around 70 tonnes over the period. This contrasts with the global picture, where total ETF holdings rose by only 18 tonnes in H1 after a 74-tonne decline in June.
US bond yields remain an additional factor for gold. The Federal Reserve's H.15 series showed the 10-year Treasury yield at 4.72% on August 10, compared with 4.65% on August 7. Elevated yields continue to increase the opportunity cost of holding non-yielding gold, although weaker US labour-market data and changing expectations for Federal Reserve policy have provided some support to bullion.
Trading activity also points to renewed investor interest in gold. In its August 10 market monitor, the World Gold Council noted stronger gold ETF inflows across all regions, higher futures net-long positioning and a more bullish tilt in the options market. Chinese investors also added nearly 6 tonnes to gold ETFs during the first week of August. However, options activity alone should not be interpreted as confirmation that the broader price trend is about to reverse.
Support and Resistance Levels
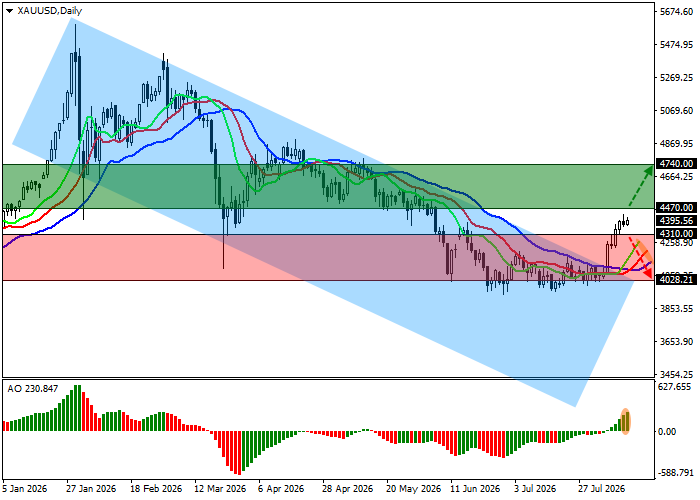
On the daily chart, XAU/USD is trading well above the resistance line of the broader descending channel with dynamic boundaries around 4,100.0 and 3,200.0.
Technical indicators continue to provide a stable bullish signal: the faster moving averages of the Alligator indicator remain above the slower line, while the Awesome Oscillator histogram is forming corrective bars in positive territory.
Resistance levels: 4,470.0, 4,740.0.
Support levels: 4,310.0, 4,028.0.
XAU/USD Trading Scenarios and Forecast
Long positions may be considered after a rise and consolidation above 4,470.0, with a target at 4,740.0 and a stop-loss at 4,350.0. Time horizon: seven days or more.
Short positions may be considered after a decline and consolidation below 4,310.0, with a target at 4,028.0 and a stop-loss at 4,410.0.
