

The consensus forecast suggests the creation of between 30.0K and 65.0K new jobs after a sharp decline of 92.0K, while the unemployment rate is expected to remain around 4.4%. These figures will serve as a key test for the dollar: a weak report could undermine its position, while strong data, especially combined with ongoing geopolitical tensions, would strengthen hawkish expectations regarding monetary policy adjustments and put pressure on AUD/USD.
In this context, it is worth highlighting recent comments from St. Louis Federal Reserve Bank President Alberto Musalem, who stated yesterday that the regulator has no need to change its current course, as inflation risks have become relevant again and economic prospects remain uncertain. At the same time, data released yesterday also reflected a decline in initial jobless claims for the week ending March 27, from 211.0K to 202.0K, while analysts had expected 212.0K, whereas continuing claims, on the contrary, increased from 1.816M to 1.841M, slightly above the market forecast of 1.84M.
Australian investors yesterday assessed the foreign trade report, which turned out positive: the trade surplus rose to 5.69B Australian dollars, more than doubling January’s figure and significantly exceeding forecasts. Exports rose 4.9% month-over-month, driven in part by nearly 30.0% growth in non-monetary gold shipments, while imports, by contrast, fell 3.2%. It is important to note that despite these strong headline figures, exports of key commodities such as iron ore, coal, and liquefied natural gas remained weak, pointing to insufficient underlying demand. In addition, the Australian Bureau of Statistics emphasized that February data do not yet reflect the impact of the Middle East conflict, and its potential negative effects are expected to appear in March reporting. Since the start of March, Brent Crude Oil has held in the 100.0–109.0 dollars per barrel range, reaching multi-year highs amid supply disruptions through the Strait of Hormuz, through which around 20.0% of global crude oil and 30.0% of liquefied natural gas shipments passed before hostilities began. Investors are responding by increasing risk premiums: amid restricted tanker traffic and possible long-term supply reductions, the market remains highly sensitive to any geopolitical signals, and volatility in commodity prices continues to intensify, reflecting expectations of large-scale conflict escalation.
At the same time, statements by President Donald Trump that Iran had requested a ceasefire were denied by the authorities of the Islamic Republic, which stressed that no direct negotiations are currently underway. Official Tehran insists on fulfilling a number of conditions, including the full lifting of sanctions, reparation payments, and guarantees of non-aggression. The United States and its allies are intensifying pressure: rhetoric from the White House about severe damage to the country’s infrastructure is increasing anxiety in global markets. In his address to the nation yesterday, Trump emphasized that until the blockade of the Strait of Hormuz is lifted, the bombing of the Islamic Republic will continue and could, in intensity, return the opponent to the “Stone Age.” Market participants fear such a step, reasonably believing that it would not contribute to resolving the situation or reopening the critical maritime route, but would instead intensify strikes by the Islamic Revolutionary Guard Corps (IRGC) against the oil, gas, and industrial infrastructure of Persian Gulf states.
Support and resistance levels
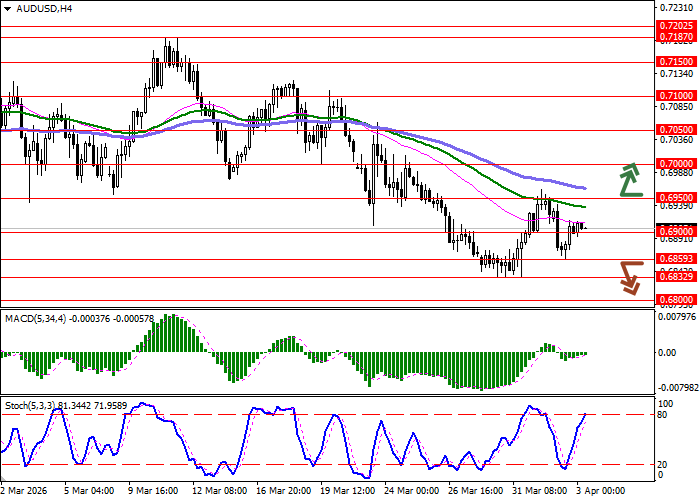
On the daily chart, Bollinger Bands are showing confident downward movement: the price range is narrowing, reflecting the mixed nature of ultra-short-term trading. MACD has turned upward, forming a new buy signal and fixing above the signal line. Stochastic is showing a similar pattern, except that the indicator line is rapidly approaching its maximum levels, pointing to overbought risks for the Australian dollar in the ultra-short term.
Resistance levels: 0.6950, 0.7000, 0.7050, 0.7100.
Support levels: 0.6900, 0.6859, 0.6832, 0.6800.
Trading scenarios and AUD/USD forecast
Short positions can be opened after a confident breakout below 0.6859 with a target at 0.6800. Stop-loss — 0.6900. Implementation period: 1–2 days.
A continuation of corrective upward dynamics followed by a breakout above 0.6950 may serve as a signal to open long positions with a target at 0.7050. Stop-loss — 0.6900.
Scenario
| Timeframe | Intraday |
| Recommendation | SELL STOP |
| Entry point | 0.6855 |
| Take Profit | 0.6800 |
| Stop Loss | 0.6900 |
| Key levels | 0.6800, 0.6832, 0.6859, 0.6900, 0.6950, 0.7000, 0.7050, 0.7100 |
Alternative scenario
| Recommendation | BUY STOP |
| Entry point | 0.6955 |
| Take Profit | 0.7050 |
| Stop Loss | 0.6900 |
| Key levels | 0.6800, 0.6832, 0.6859, 0.6900, 0.6950, 0.7000, 0.7050, 0.7100 |
