
For its part, the U.S. Federal Reserve cut the policy rate by 25 basis points last week for the second time this year. The move aims to support the economy and reduce labor-market risks, but divisions within the FOMC over the path ahead are widening. According to the statement, the decision passed with ten votes in favor and two against: Governor Steven Miran advocated a larger 50 bp cut, while Kansas City Fed President Jeffrey Schmid preferred to hold. Analysts believe the reduction in borrowing costs should provide a modest boost to the economy amid softening activity and the negative effects of the tariff policy pursued by President Donald Trump.
As a result, the widening gap in policy expectations between the Fed and the ECB — together with weak eurozone industrial data — creates scope for a limited EUR/USD decline in the near term. Today’s PMI prints could offer a temporary lift if they beat forecasts, but the balance of risks still tilts toward the dollar. Near-term, the trading range will likely remain within 1.1450–1.1600, with a risk of revisiting local lows.
Support and Resistance
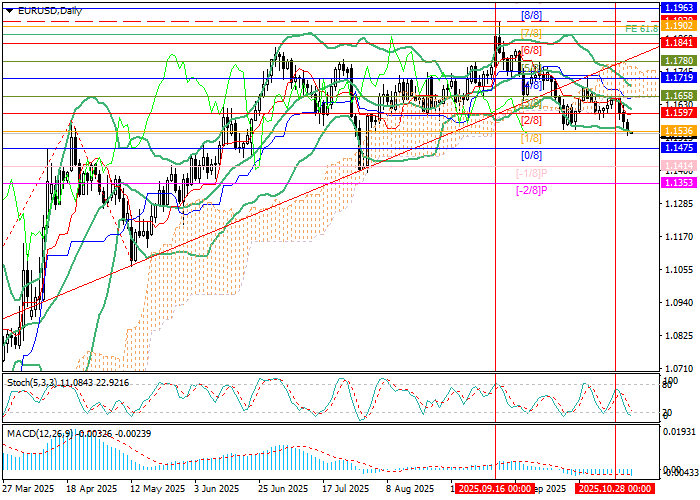
The pair continues a corrective pullback within the broader uptrend that began in mid-September after the yearly highs near 1.1920. Price is currently testing support at 1.1536 (Murray level [1/8]); a sustained break below would open the way toward 1.1414 (Murray [–1/8]) and 1.1354 (Murray [–2/8]). For bulls, the key level is 1.1719 (Murray [4/8]), reinforced by the upper Bollinger Band: a breakout there would target 1.1841 (Murray [6/8]) and 1.1920 (the yearly highs area).
Signals are mixed across indicators: Bollinger Bands slope lower and MACD is rising in negative territory — confirming a short-term bearish phase — while Stochastic has entered oversold, allowing for an upside reversal.
Resistance: 1.1719, 1.1841, 1.1920.
Support: 1.1536, 1.1414, 1.1354.
EUR/USD Trading Scenarios and Outlook
Consider short positions below 1.1536 with targets at 1.1414 and 1.1354, and a stop-loss at 1.1620. Horizon: 5–7 days.
Consider long positions from 1.1719 with targets at 1.1841 and 1.1920, and a stop-loss at 1.1630.
Scenario
| Timeframe | Weekly |
| Recommendation | SELL STOP |
| Entry Point | 1.1535 |
| Take Profit | 1.1414, 1.1354 |
| Stop Loss | 1.1620 |
| Key Levels | 1.1354, 1.1414, 1.1536, 1.1719, 1.1841, 1.1920 |
Alternative Scenario
| Recommendation | BUY STOP |
| Entry Point | 1.1720 |
| Take Profit | 1.1841, 1.1920 |
| Stop Loss | 1.1630 |
| Key Levels | 1.1354, 1.1414, 1.1536, 1.1719, 1.1841, 1.1920 |
