Ethereum's staking exit queue increased more than fivefold in just three days, reaching a peak of around 851,000 ETH after MetaMask began proactively withdrawing thousands of validators following a security incident.
Optimism governance has approved the re-designation of 546.9 million OP, worth approximately $49.7 million at the time of the vote, from the allocation reserved for future user airdrops to a Strategic Ecosystem Fund managed by the Optimism Foundation.
For roughly three months, XRP/USD traded sideways within the 1.1718–1.0253 range, corresponding to the Murrey [4/8]–[1/8] levels. Since mid-July, however, the pair has resumed its decline amid uncertainty surrounding delayed Senate consideration of the CLARITY Act. The legislation is intended to establish a broader US regulatory framework for digital assets, but it does not specifically classify XRP as a non-security. XRP's legal treatment remains tied to the Ripple case, in which the court did not find XRP itself to be inherently a security, while certain institutional sales were treated as investment contracts.
SOL/USD has been trending lower since last month. However, the pair has recently recovered part of its losses and is now trading near the middle Bollinger Band at 75.00, the Murrey [4/8] level. Overall, the chart resembles a Symmetrical Triangle pattern, which could break in either direction. If the price consolidates below the lower Bollinger Band at 71.88, the Murrey [3/8] level, the decline may continue toward 62.50, the Murrey [0/8] level, and 56.25, the Murrey [–2/8] level. However, a breakout above 78.12, the Murrey [5/8] level, could support a renewed advance toward 87.50, the Murrey [8/8] level, 93.75, the Murrey [+2/8] level, and 98.40, the area of the May highs.
Ethereum researchers have proposed a major change to ETH issuance that would gradually burn a larger share of validator rewards as the staking ratio rises. The idea is not to impose a hard 50% staking cap, but to remove the protocol-level incentive for staking to keep expanding beyond that point.
Ethereum researchers have proposed burning a growing share of validator rewards in an attempt to prevent the staking ratio from rising indefinitely. The draft, known as EIP-8363, has already triggered a heated debate over validator economics, decentralisation and the possible consequences for DeFi.
Since late June, ETH/USD has been attempting an upward correction within a long-term downtrend. However, the price has now remained within the sideways range of 1937.50–1812.50, corresponding to the Murrey [7/8]–[5/8] levels, for more than three weeks. The prolonged slowdown in price growth may indicate that the upside potential is becoming exhausted. Nevertheless, a breakout above 2000.00, the Murrey [8/8] level and the middle Bollinger Band on the weekly chart, could support an advance toward 2125.00, the Murrey [+2/8] level, and 2500.00, the Murrey [4/8] level on the weekly chart. However, if the price consolidates below 1750.00, the Murrey [4/8] level, the decline may resume toward 1500.00, the Murrey [0/8] level, and 1375.00, the Murrey [–2/8] level.
Since the beginning of the month, SOL/USD has remained under pressure, trading near 71.88, the Murrey [3/8] level. The chart configuration resembles a symmetrical triangle that may break in either direction. A sustained move below 71.88, which also coincides with the lower Bollinger Band, could push the pair toward 65.62, the Murrey [1/8] level, and 62.50, the Murrey [0/8] level. Meanwhile, a breakout above 78.12, the Murrey [5/8] level, would breach the upper boundary of the pattern and strengthen bullish momentum, opening the way toward 87.50, the Murrey [8/8] level, and 93.75, the Murrey [+2/8] level.
Since the end of last month, the ETH/USD pair has been attempting to enter a correction against the long-term downward trend. On Monday, the price reached a two-week high of 1,978.60 but subsequently gave up part of those gains.
Since the beginning of the month, the XRP/USD pair has been attempting to recover its previous losses, correcting against the long-term downward trend. The price has approached 1.1718 (Murrey level [4/8]) several times but has failed to break above it. The decline has now resumed, and a breakdown below 1.0253 (Murrey level [1/8]) may accelerate the move toward 0.9277 (Murrey level [–1/8]) and 0.8789 (Murrey level [–2/8]). Meanwhile, 1.1718 remains the key level for buyers: consolidation above it would reverse the current trend and create momentum for a test of 1.2695 (Murrey level [6/8]), 1.3671 (Murrey level [8/8]) and 1.4648 (Murrey level [+2/8]).
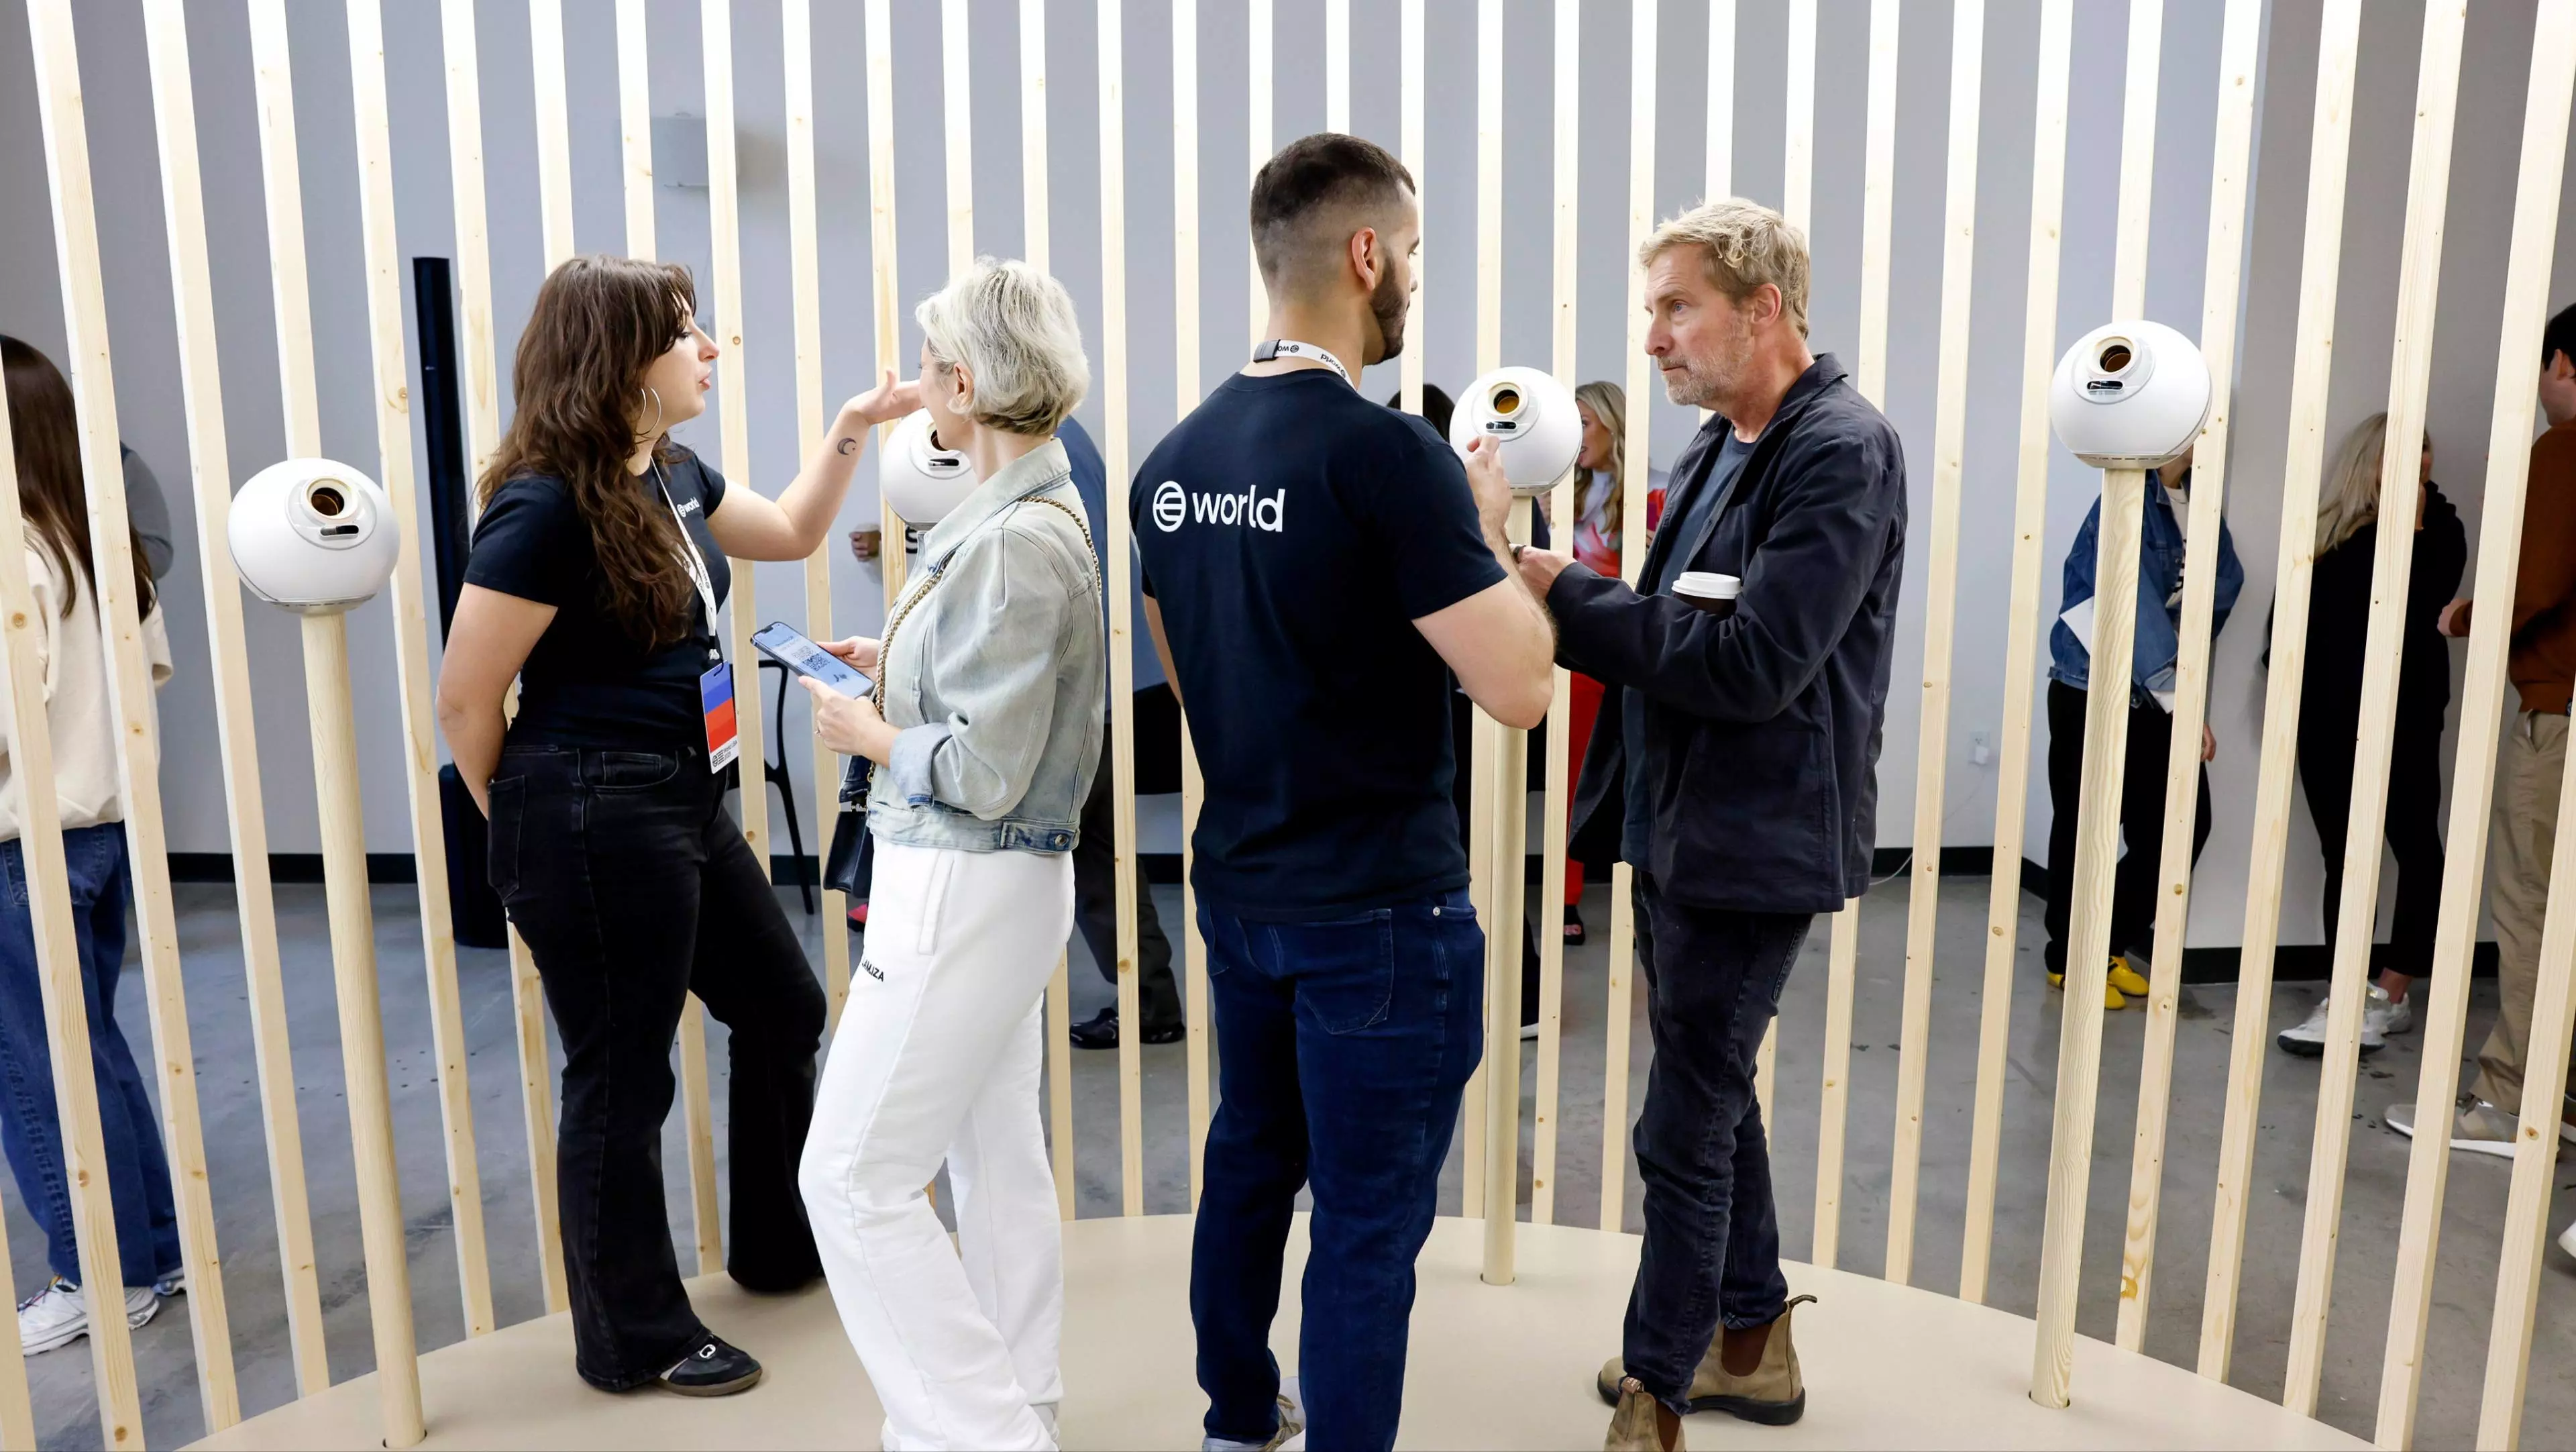
World Foundation has raised an initial $52.5 million through a strategic sale of WLD tokens, with all tokens sold in the transaction subject to a 12-month lockup.
B² Network, a network designed to make Bitcoin transactions faster and less expensive, has become the latest victim of what is already being described as a disastrous “Hacker Day” for the crypto industry.
Since the beginning of the month, the XRP/USD pair has been attempting to recover its previous losses and has now approached 1.1718 (Murrey level [4/8]) for the second time, although it has yet to break through this level. The chart configuration resembles an ascending triangle pattern, so a breakout above 1.1718 could signal a shift in the prevailing trend and strengthen bullish momentum toward 1.2695 (Murrey level [6/8]), 1.3671 (Murrey level [8/8]) and 1.4648 (Murrey level [+2/8]). The key level for sellers is 1.0742 (Murrey level [2/8], the lower Bollinger Band). A consolidation below this level would signal a breakout through the lower boundary of the pattern and could lead to tests of 0.9765 (Murrey level [0/8]) and 0.8789 (Murrey level [–2/8]).