
Analysts expect a 25 basis point rate cut to 3.75%. According to the CME FedWatch Tool, traders price the probability of this scenario at 89.4%, as recent macroeconomic indicators continue to confirm a further cooling of the labor market (U.S. employment decreased by 32,000 in November, according to Automatic Data Processing (ADP)) and weakening inflationary pressure (the core Personal Consumption Expenditures index slowed from 2.9% to 2.8% in September).
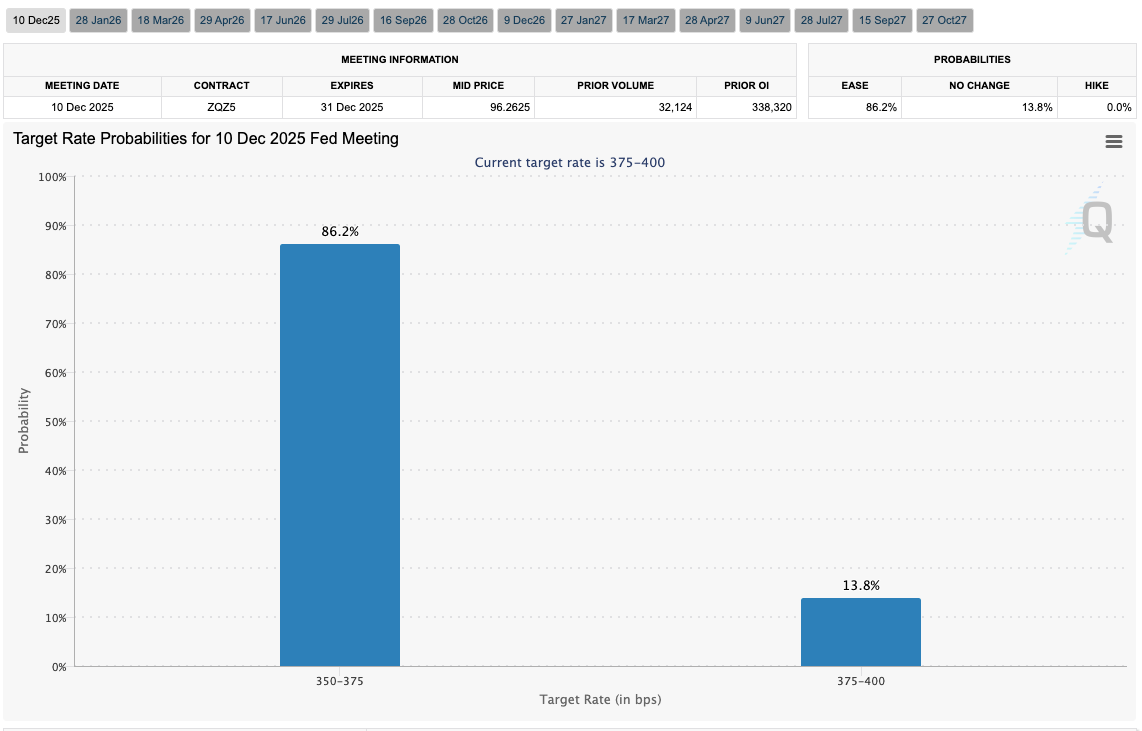
Macroeconomic data is unlikely to affect the Fed’s decision at this point, although the JOLTS job openings for September and October will be released today at 17:00 (GMT+2), providing a clearer picture, as the U.S. Labor Department report was not published last Friday. Analysts remain divided over the regulator’s next steps in 2026: a pause in the “dovish” cycle may follow immediately or after an additional 25 bps cut in January. Meanwhile, investors rely on updated University of Michigan data released on Friday: one-year inflation expectations were revised from 4.5% to 4.1%, and five-year expectations from 3.4% to 3.2%, which may influence monetary policy.
Support for the euro also came from German industrial production statistics. In October, monthly growth accelerated from 1.1% to 1.8% (forecast: –0.4%), while annual dynamics shifted from –1.0% to 0.8%. At the same time, the Sentix Investor Confidence Index rose from –7.4 to –6.2 points in December. The sub-index of current economic conditions improved from –17.5 to –16.5 points, and the six-month expectations index increased from 3.3 to 4.8 points.
Later today at 09:00 (GMT+2), investors will focus on Germany’s October foreign trade data. Forecasts suggest a 0.2% decline in exports after a 1.4% increase last month, while imports may slow sharply from 3.1% to 0.2%, likely reducing the trade surplus from €15.3 billion to €15.2 billion.
Support and Resistance Levels
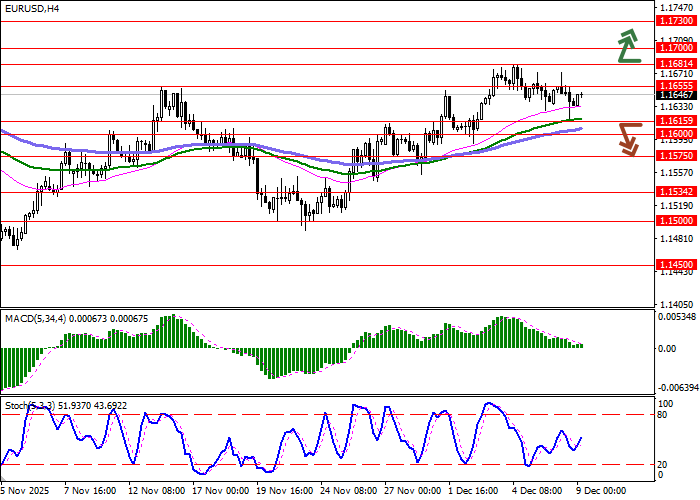
Bollinger Bands on the daily chart show moderate growth. Price range remains wide enough for current trading activity. MACD is rising and continues to provide a weak buy signal (the histogram is above the signal line). Stochastic, however, shows a steady downward movement, largely ignoring attempts by buyers to take control early in the trading week.
Resistance levels: 1.1655, 1.1681, 1.1700, 1.1730.
Support levels: 1.1615, 1.1600, 1.1575, 1.1534.
EUR/USD Trading Scenarios and Forecast
Short positions may be opened after a confident breakout below 1.1615 with a target at 1.1534. Stop-loss — 1.1655. Implementation time: 2–3 days.
If bullish momentum develops and the price breaks above 1.1681, long positions may be opened with a target at 1.1730. Stop-loss — 1.1655.
Scenario
| Timeframe | Intraday |
| Recommendation | SELL STOP |
| Entry Point | 1.1615 |
| Take Profit | 1.1534 |
| Stop Loss | 1.1655 |
| Key Levels | 1.1534, 1.1575, 1.1600, 1.1615, 1.1655, 1.1681, 1.1700, 1.1730 |
Alternative Scenario
| Recommendation | BUY STOP |
| Entry Point | 1.1685 |
| Take Profit | 1.1730 |
| Stop Loss | 1.1655 |
| Key Levels | 1.1534, 1.1575, 1.1600, 1.1615, 1.1655, 1.1681, 1.1700, 1.1730 |