

The focus of investors and forex traders is once again shifting back to the bond market and macroeconomic data, which could influence the Federal Reserve’s interest rate decision at the end of January. This week, several Fed officials commented on the current and future direction of monetary policy. Atlanta Federal Reserve Bank President Raphael Bostic stated that borrowing costs should have remained unchanged until the end of 2026 due to concerns about a rapid acceleration in inflation. Meanwhile, Federal Reserve Governor Christopher Waller, who is considered one of the potential candidates for the next Fed Chair position, argued in favor of a more active pace of rate cuts, pointing to cooling labor market conditions in October and November.
Another factor weighing on the equity market was a statement from Oracle Corp., a major company in the development and deployment of artificial intelligence (AI) infrastructure. Oracle announced that its ambitious project to build a data center in Michigan with a capacity exceeding 1 gigawatt will proceed without the participation of asset manager Blue Owl Capital Inc. Blue Owl had been the largest partner, prepared to invest up to $10.0 billion in the first phase of construction, but withdrew due to capacity constraints. The project will now be advanced in partnership with AI developer OpenAI Inc. This development increased pressure on Oracle Corp., whose shares have lost nearly 40.0% in value since early September, and has heightened investor concerns about the stability of AI technology expansion.
Positive dynamics persist in the bond market: yields on 10-year Treasuries have eased from 4.200% at the end of last week to 4.142%, 20-year yields declined from 4.813% to 4.777%, and 30-year yields fell from 4.857% to 4.821%.
The top gainers within the index include Devon Energy Corp. (+5.30%), FMC Corp. (+4.71%), ConocoPhillips (+4.62%), and Occidental Petroleum Corp. (+4.39%).
The largest decliners are led by GE Vernova LLC (–10.50%), Vistra Energy Corp. (–7.77%), Generac Holdings Inc. (–6.78%), and Constellation Energy Corp. (–6.74%).
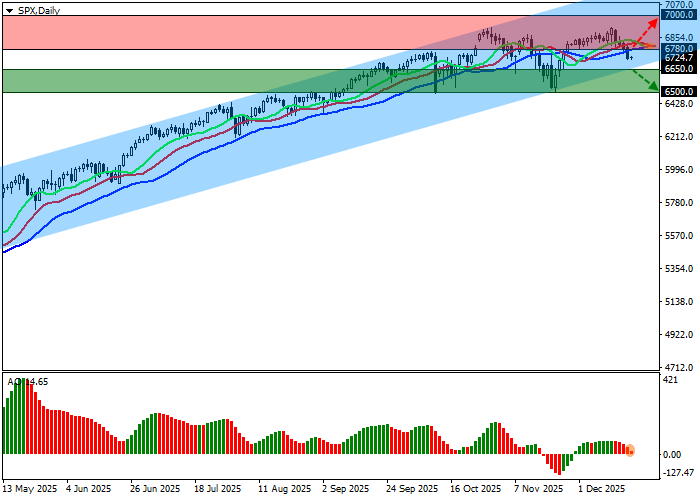
Support and resistance levels
The index is undergoing a correction while maintaining an upward trend on the daily chart, marking a local attempt at renewed downside movement within the 7300.0–6600.0 channel.
Technical indicators are delivering an unstable buy signal: the fast EMAs within the Alligator indicator are approaching the signal line, while the AO histogram remains in the buying zone but is forming corrective bars.
Support levels: 6650.0, 6500.0.
Resistance levels: 6780.0, 7000.0.
Trading scenarios and S&P 500 forecast
If the decline continues and the price consolidates below the 6650.0 support level, short positions will be relevant with a target at 6500.0. Stop loss — 6750.0. Time horizon: 7 days or more.
If growth resumes and the price consolidates above the 6780.0 resistance level, long positions will be relevant with a target at 7000.0. Stop loss — 6650.0.
Scenario
| Timeframe | Weekly |
| Recommendation | SELL STOP |
| Entry point | 6650.0 |
| Take Profit | 6500.0 |
| Stop Loss | 6750.0 |
| Key levels | 6500.0, 6650.0, 6780.0, 7000.0 |
Alternative scenario
| Recommendation | BUY STOP |
| Entry point | 6780.0 |
| Take Profit | 7000.0 |
| Stop Loss | 6650.0 |
| Key levels | 6500.0, 6650.0, 6780.0, 7000.0 |
