
Forex Market Review: Dollar Gains as Eurozone Growth Slows
United States of America. The US dollar is strengthening against the euro and the pound, while showing mixed performance against the yen.
United States of America. The US dollar is strengthening against the euro and the pound, while showing mixed performance against the yen.

 By Sagar Dua
Shares of Adobe Inc. (ADBE), a leading US software developer, are trading near 238.00.
 By Sagar Dua
For the third consecutive week, the GBP/USD pair has been trading mainly within the sideways range of 1.3305–1.3183 (Murray levels [2/8]–[0/8]), awaiting significant market drivers, although the pound has recently begun testing a move above the upper boundary.
 By Sagar Dua
Over the past four weeks, the AUD/USD pair has been declining steadily, reaching four-month lows near 0.6900.
 By Sagar Dua
The FTSE 100, the benchmark index of the London Stock Exchange, is showing a local upward trend, trading near 10669.0, although escalating geopolitical tensions in the Persian Gulf region continue to limit the development of a more sustained recovery.
 By Sagar Dua
Benchmark Brent Crude Oil prices continue to move within a global corrective trend, trading near 105.00 amid persistent geopolitical tensions in the Persian Gulf region.
 By Sagar Dua
Against the backdrop of a stronger US dollar, the EUR/USD pair is correcting near 1.1170.
 By Sagar Dua
United States. The US dollar is weakening against the euro and pound but strengthening against the Japanese yen.
 By Sagar Dua
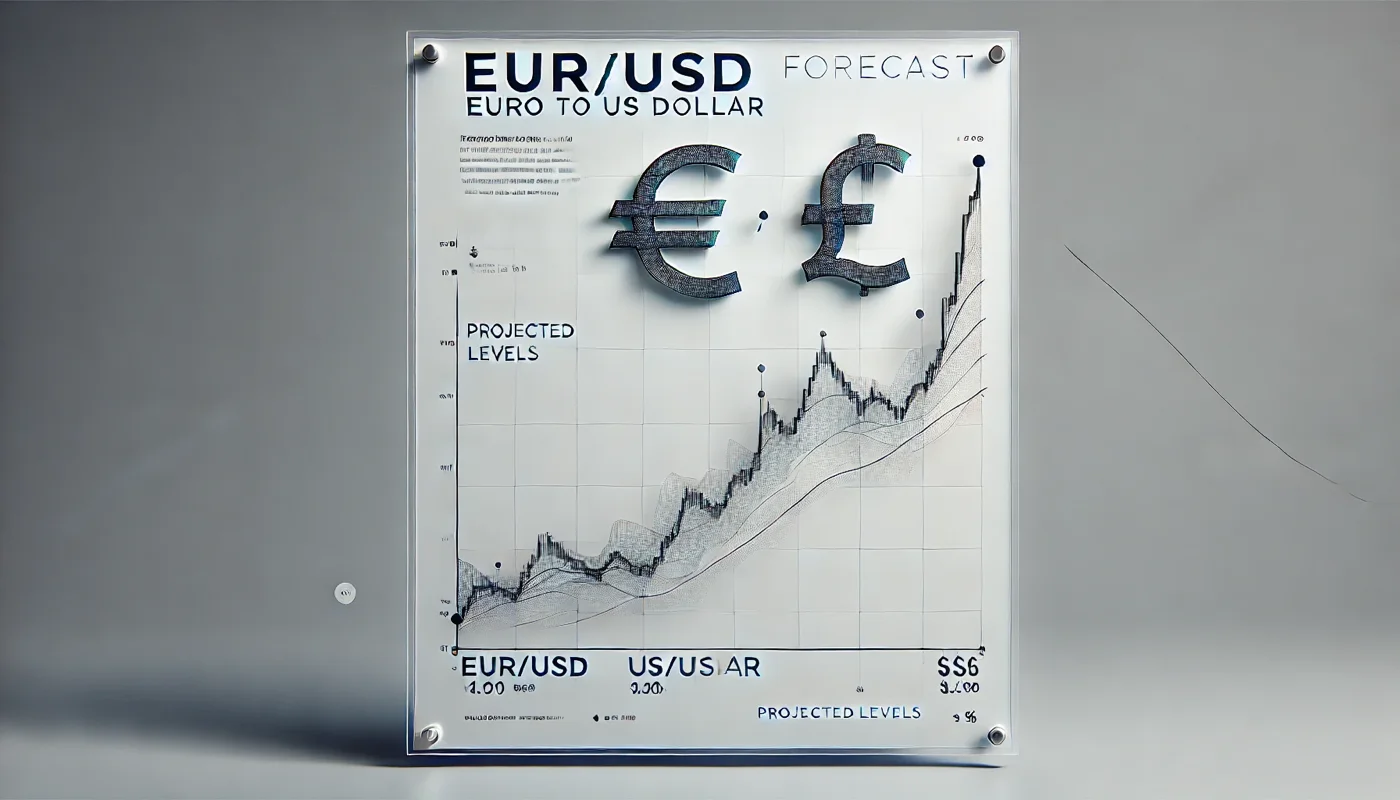
The EUR/USD pair continues to move within a long-term downtrend and is testing the 1.1230 level (Murray level [0/8]) this week, attempting to break below the lower boundary of the trading range. A successful breakout could open the way toward 1.1108 (Murray level [–2/8]), 1.0986 (Murray level [–2/8], W1) and 1.0850 (61.8% Fibonacci retracement). However, if the price breaks above the middle Bollinger Band at 1.1352 (Murray level [2/8]), growth may resume toward 1.1535 (Murray level [5/8], 23.6% Fibonacci retracement), 1.1718 (Murray level [8/8], upper boundary of the descending channel) and 1.1840 (Murray level [+2/8]).
 By Sagar Dua
XPT/USD, D1. On the daily chart, the XPT/USD pair has consolidated below 1742.70 (23.6% Fibonacci retracement) and continues to decline toward 1537.97 (0.0% retracement) and 1365.00 (61.8% extension). However, if the price reverses and breaks back above the middle Bollinger Band at 1742.70, growth may resume toward 1868.35 (38.2% retracement), 1969.55 (50.0% retracement) and 2073.00 (61.8% retracement), although the price would still need to break through the descending fan.
 By Sagar Dua
The leading US stock index, the Dow Jones Industrial Average (DJIA), is showing a local corrective trend, trading near 51309.0.
By Sagar Dua Benchmark Brent Crude Oil prices continue to move within a global corrective trend, trading near 103.00 amid persistent geopolitical tensions in the Persian Gulf region.
By Sagar Dua Against the backdrop of positive US dollar dynamics, the AUD/USD pair is moving within a downward trend and is trading near 0.6978, despite supportive macroeconomic signals from Australia.
Latest Forex and commodity market news, analysis, and trends from FORECK.INFO. Markets are driven by macro data, central bank decisions, earnings, and supply-demand factors. Technical analysis helps identify trends, key levels, and potential trading opportunities while managing risk.